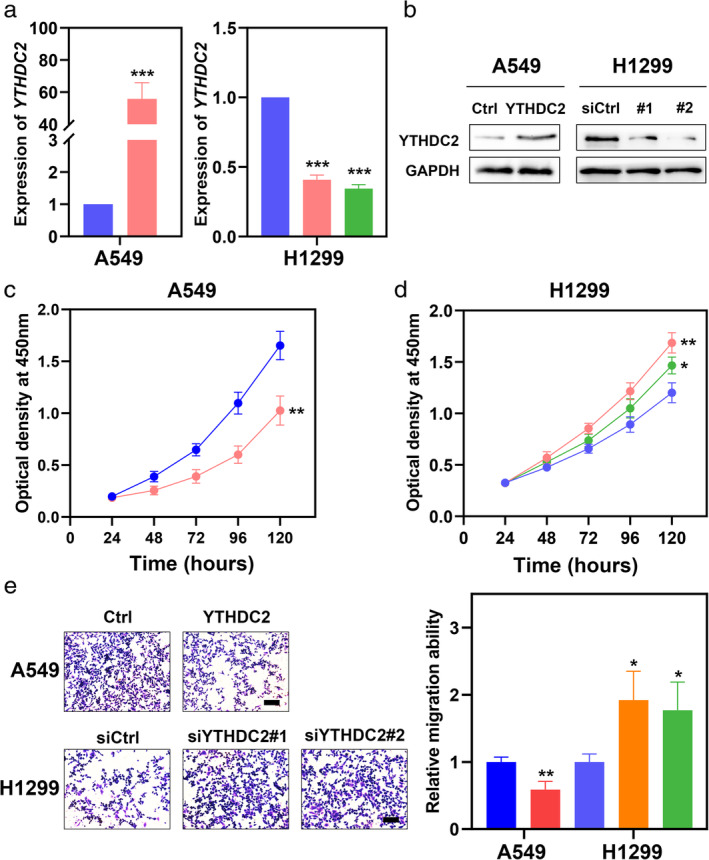
Figure 3.

YTHDC2 inhibits proliferation and migration of NSCLC cell lines. (a, b) Empty or YTHDC2 expressing plasmids were transfected into A549 cells ( ) Ctrl (
 ) YTHDC2 (
 ) siCtrl (
 ) siYTHDC2#1 (
 ) siYTHDC2#2. Negative control or YTHDC2‐siRNAs (siYTHDC2 #1, #2) were transfected into H1299 cells. The mRNA and protein expression of YTHDC2 was verified by qPCR and western blot. P‐values were calculated using a two‐sided unpaired Student's t‐test. (c, d) CCK8 assay was performed in A549 and H1299 cell lines transfected with YTHDC2 expressing plasmids or YTHDC2‐siRNAs (
 ) Ctrl (
 ) YTHDC2 (
 ) siCtrl (
 ) siYTHDC2#1 (
 ) siYTHDC2#2. P‐values were calculated using a two‐sided unpaired Student's t‐test. (e) Transwell assay was performed in A549 and H1299 cell lines transfected with YTHDC2 expressing plasmids or YTHDC2‐siRNAs (
 ) Ctrl (
 ) YTHDC2 (
 ) siCtrl (
 ) siYTHDC2#1 (
 ) siYTHDC2#2. P‐values were calculated using a two‐sided unpaired Student's t‐test. Scale bars, 100 μm. *, P < 0.05; **, P < 0.01; ***, P < 0.001.
