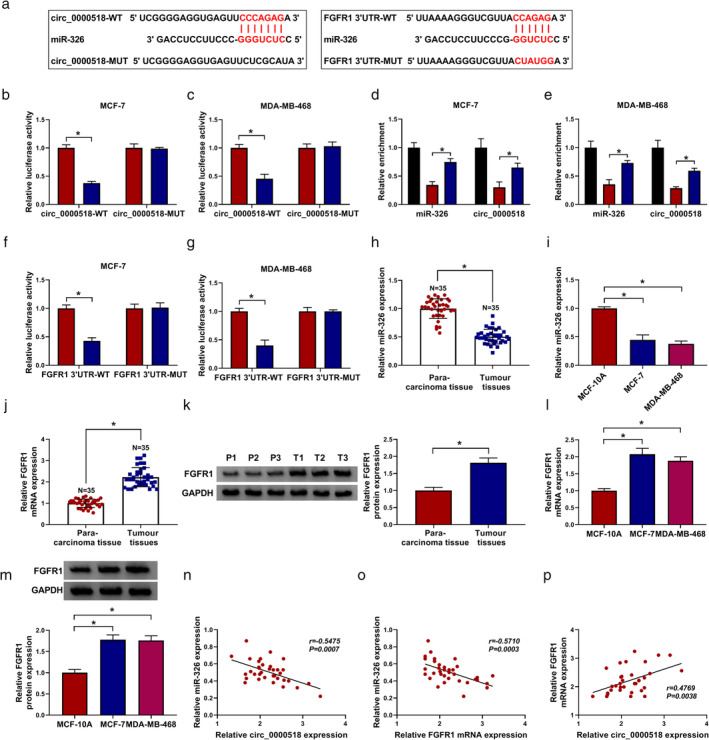
Figure 3.

Circ_0000518 acted as a sponge for miR‐326, which targeted FGFR1 in BC cells. (a) The binding sites between miR‐326 and circ_0000518 or FGFR1 were predicted with circInteractome or targetscan databases. (b and c) Dual‐luciferase reporter assay was conducted to evaluate the luciferase activity of luciferase reporters with circ_0000518‐WT or circ_0000518‐MUT in MCF‐7 and MDA‐MB‐468 cells transfected with miR‐326 or miR‐NC. (d and e) After RIP assay, the enrichment of miR‐326 and circ_0000518 was examined using qRT‐PCR. (f and g) Dual‐luciferase reporter assay revealed the luciferase activities of the FGFR1 3′UTR‐WT and FGFR1 3′UTR‐MUT reporters in MCF‐7 and MDA‐MB‐468 cells transfected with miR‐326 or miR‐NC. (h and i) Expression levels of miR‐326 in BC tissues and para‐carcinoma tissues, as well as BC (MCF‐7 and MDA‐MB‐468) and MCF‐10A cells, were assessed by qRT‐PCR. (j–m) The mRNA and protein levels of FGFR1 in BC tissues and para‐carcinoma tissues, as well as BC (MCF‐7 and MDA‐MB‐468) and MCF‐10A cells, were detected by qRT‐PCR or western blotting. (n–p) The correlation among miR‐326, circ_0000518, and FGFR1 in BC tissues was determined via Pearson's correlation analysis. The experiments were repeated three times. Data are shown as mean ± standard deviation. *P < 0.05. (b) MCF‐7 ( ) miR‐NC and (
 ) miR‐326. (c) MDA‐MB‐468 (
 ) miR‐NC and (
 ) miR‐326. (d) MCF‐7 (
 ) input, (
 ) anti‐IgG, and (
 ) anti‐Ago2. (e) MDA‐MB‐468 (
 ) anti‐IgG, (
 ) input, and (
 ) anti‐Ago2. (f) MCF‐7 (
 ) miR‐NC and (
 ) miR‐326. (g) MDA‐MB‐468 (
 ) miR‐NC and (
 ) miR‐326.
