
Figure 7.
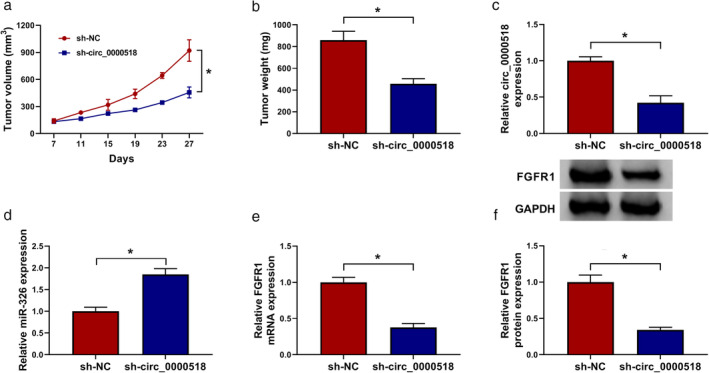
Circ_0000518 silencing could decrease BC growth in vivo. (a) The growth curves of tumor volume of the sh‐circ_0000518 and sh‐NC groups. (b) Xenograft tumor weight of the sh‐circ_0000518 and sh‐NC groups was assessed on day 27. (c–f) The levels of circ_0000518, miR‐326, FGFR1 mRNA and protein in mice tumor tissues of the sh‐circ_0000518 and sh‐NC groups were determined with qRT‐PCR or western blotting. The experiments were repeated three times. Data are shown as mean ± standard deviation. *P < 0.05. (a) ( ) sh‐NC and (
 ) sh‐circ_0000518. (b) (
 ) sh‐NC and (
 ) sh‐circ_0000518. (c) (
 ) sh‐NC and (
 ) sh‐circ_0000518. (d) (
 ) sh‐NC and (
 ) sh‐circ_0000518. (e) (
 ) sh‐NC and (
 ) sh‐circ_0000518. (f) (
 ) sh‐NC and (
 ) sh‐circ_0000518.