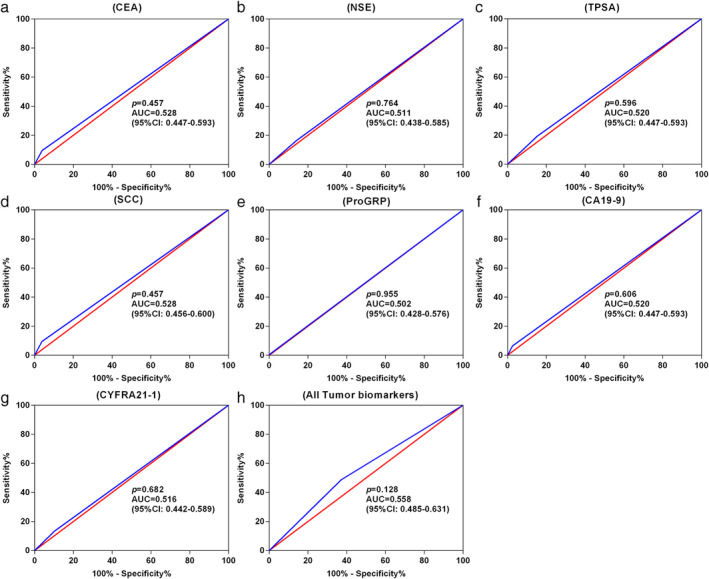
Figure 4.

ROC curves for various tumor biomarkers to discriminate stage I NSCLC patients from healthy participants. (a) CEA; (b) NSE; (c) TPSA; (d) SCC; (e) ProGRP; (f) CA19‐9; (g) CYFRA21‐1; and (h) all tumor biomarkers (including CEA, NSE, TPSA, SCC, ProGRP, CA19‐9 and CYFRA21‐1). ROC, receiver operating characteristic; AUC, area under curve; CEA, carcinoembryonic antigen; NSE, neuron‐specific enolase; TPSA, total prostate specific antigen; SCC‐Ag, squamous cell carcinoma antigen; ProGRP, progastrin‐releasing peptide; CA19‐9, carbohydrate antigen 19‐9; CYFRA21‐1, cytokeratin 19 fragment 21‐1. (a) ( ) Sensitivity % and (
 ) identity %. (b) (
 ) Sensitivity % and (
 ) identity %. (c) (
 ) Sensitivity % and (
 ) identity %. (d) (
 ) Sensitivity % and (
 ) identity %. (e) (
 ) Sensitivity % and (
 ) identity %. (f) (
 ) Sensitivity % and (
 ) identity %. (g) (
 ) Sensitivity % and (
 ) identity %. (h) (
 ) Sensitivity % and (
 ) identity %.
