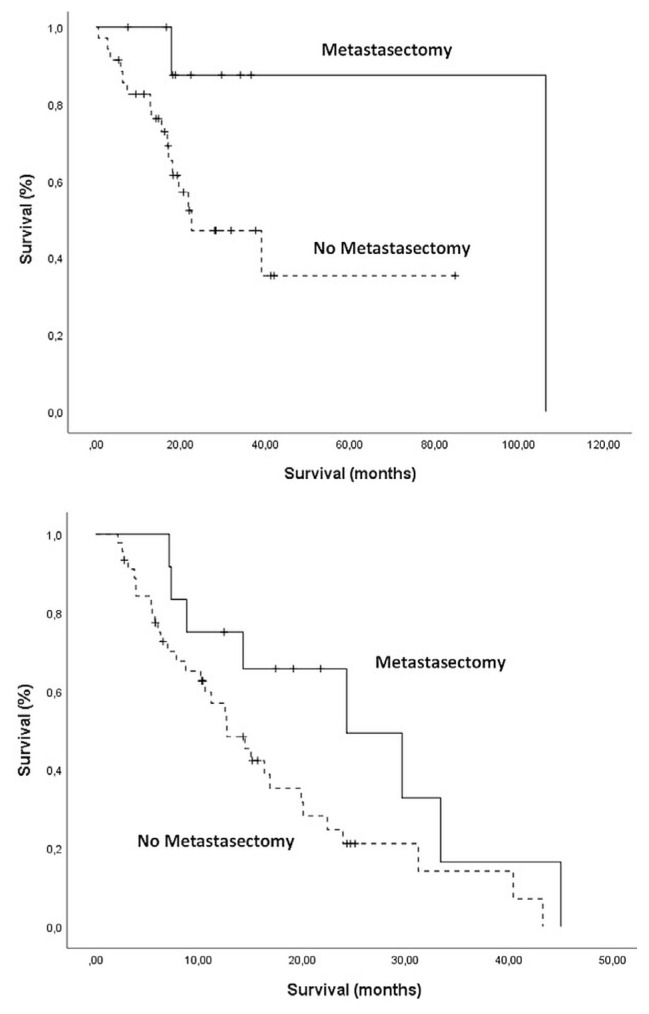
FIGURE 3.
Kaplan–Meier survival analyses by risk group and history of metastasectomy. (A) In the low-risk group [neutrophil-to-lymphocyte ratio (NLR) < 2.35], median overall survival was longer for patients receiving than not receiving metastasectomy (p = 0.05). (B) In the high-risk group (NLR ≥ 2.35), median overall survival was nonsignificantly different for patients receiving and not receiving metastasectomy (p = 0.08).

