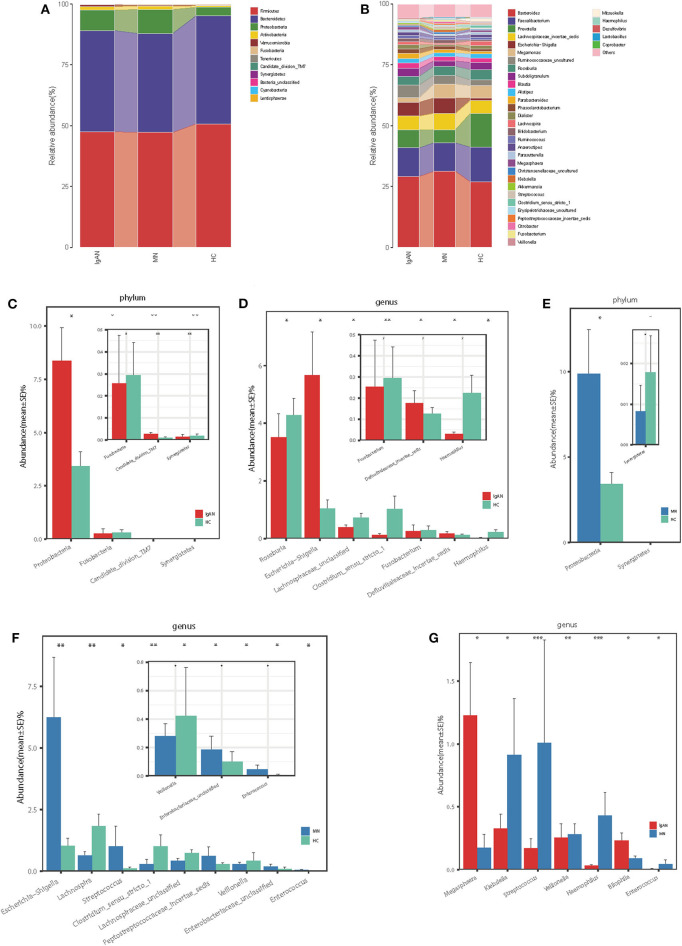
Figure 2.
Phylogenetic profiles of gut microbes among patients with IgAN (n = 44), patients with MN (n = 40) and HC (n = 30). Composition of fecal microbiota at the phylum level (A) and genus level (B) among the three groups. The different microbial community at the phylum level (C) and genus level (D) in IgAN patients vs. HC. The different microbial community at the phylum level (E) and genus level (F) in MN patients vs. HC. The different microbial community at the genus level (G) in IgAN patients vs. MN patients.*P < 0.05, **P < 0.01. IgAN, immunoglobulin A nedphropathy; MN, membranous nephropathy; HC, healthy controls.

