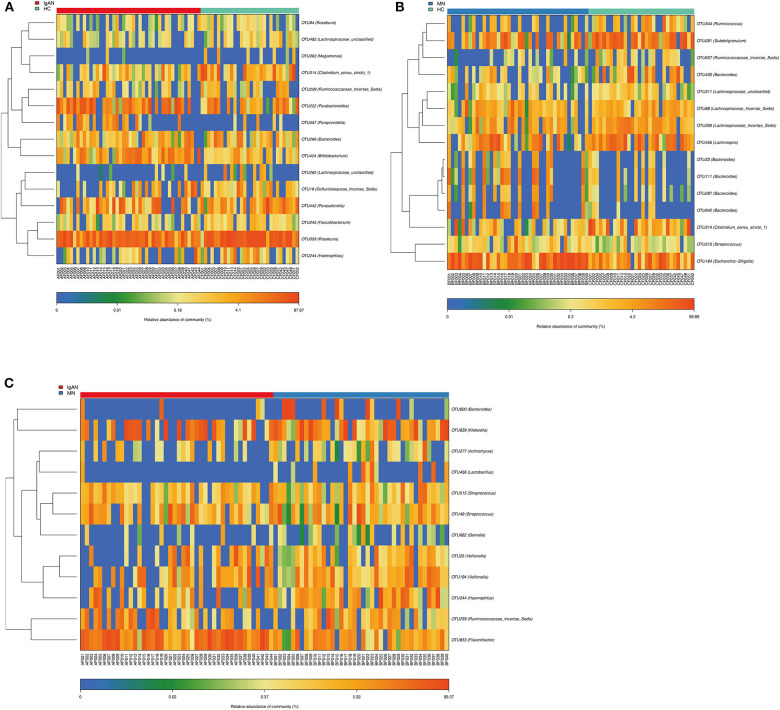
Figure 3.
Identification of key Operational Taxonomy Units (OTUs) phylotypes between groups. (A) Abundance distribution of the 15 OTUs identified as key phylotypes for IgAN: six OTUs were enriched (orange font), while nine OTUs were decreased (blue font). (B) Abundance distribution of the 15 OTUs identified as key phylotypes for MN: seven OTUs were enriched (orange font), while eight OTUs were decreased (blue font). (C) Abundance distribution of the 12 OTUs identified as key variables between patients of IgAN and MN: three OTUs were increased in IgAN(orange font), 9 OTUs were increased in MN(orange font).

