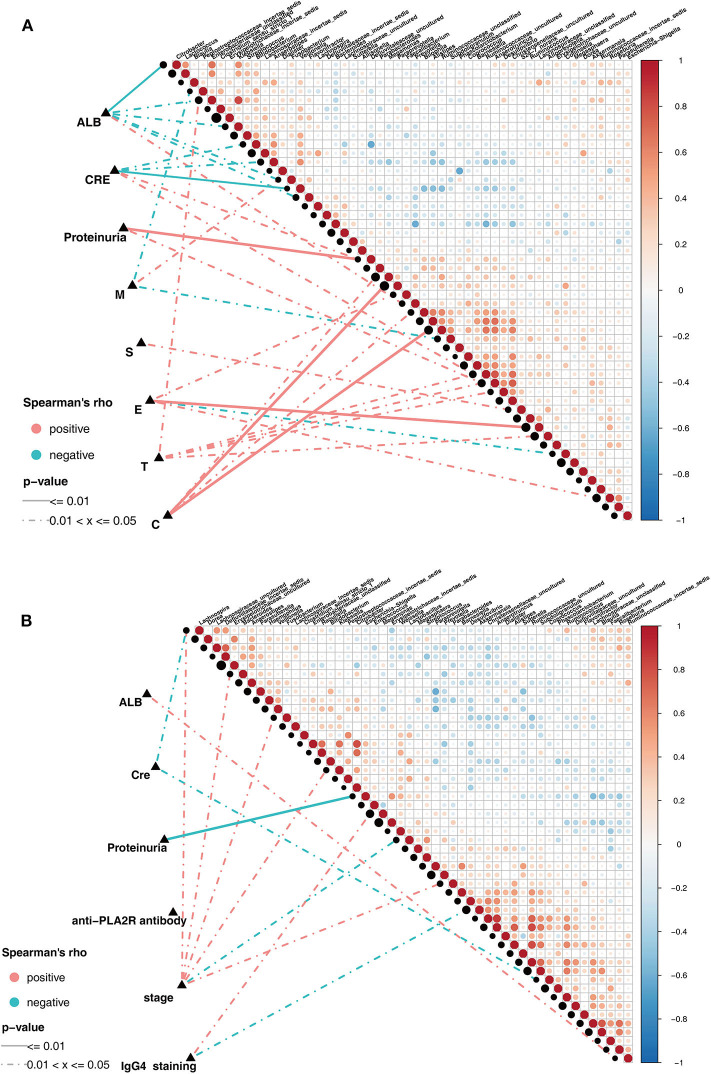
Figure 5.
Spearman correlations in patients with IgAN and MN. (A) The oblique triangle heatmap indicated ataxon-taxon correlation in IgAN patients, the red circle represented positive correlation, the blue circle represented negative correlation. The correlation network indicated a correlation between faecalmicrobiota and clinical parameters in IgAN patients, the line of solid and dotted indicated strong and weak correlations respectively. (B) The oblique triangle heatmap indicated ataxon-taxon correlation in MN patients, the red circle represented positive correlation, the blue circle represented negative correlation. The correlation network indicated a correlation between faecalmicrobiota and clinical parameters in MN patients, the line of solid and dotted indicated strong and weak correlations respectively.

