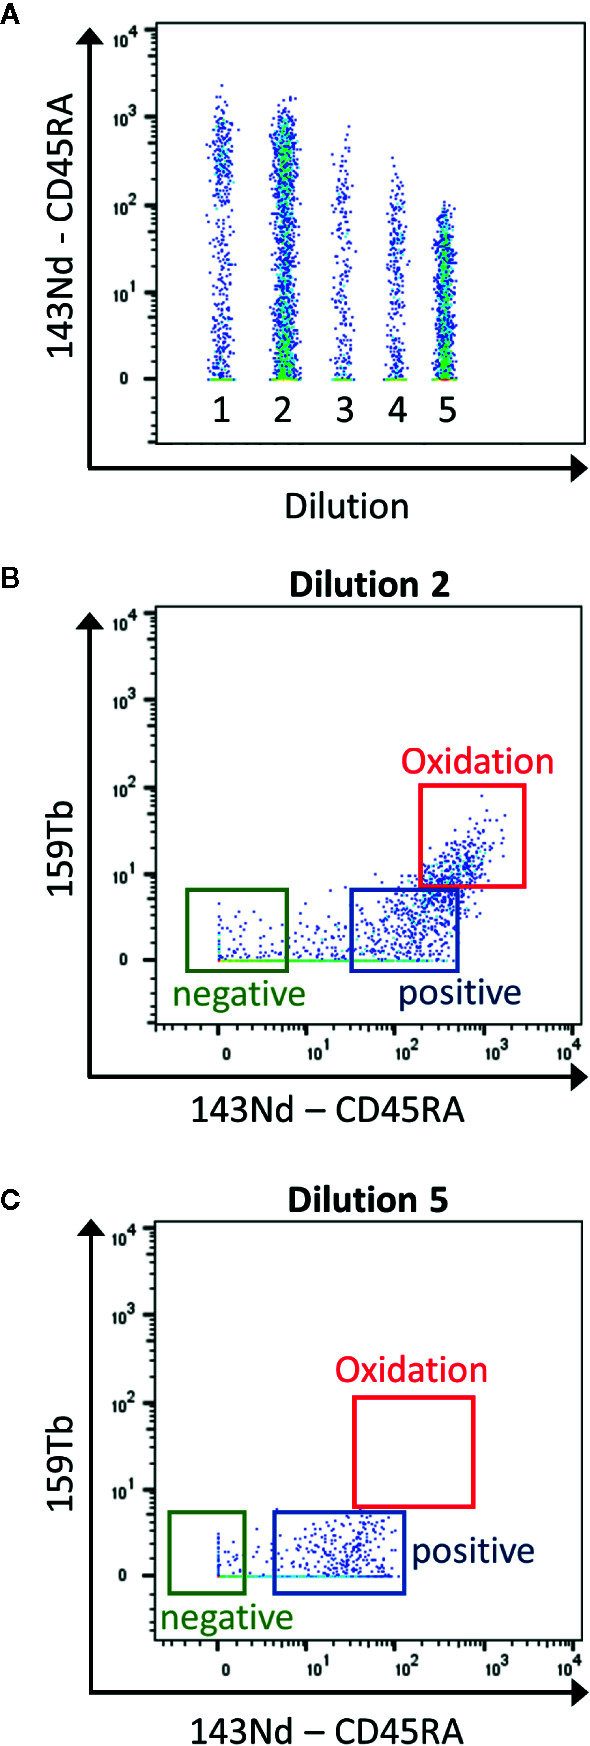
Figure 2.

Determination of the contamination due to metal oxidation during the titration. (A) The samples are concatenated in order to display the 5 dilutions for the CD45RA antibody in the same graph (1 to 5: range from 1:1 to 1:81 dilutions) (B) Using the second dilution (1:3), the CD45RA antibody gives a signal in the empty 159Tb channel, corresponding to oxidation of the metal (red box). (C) This signal is clearly reduced using the 5th dilution (1:81). This dilution will be used as it has the lowest contamination, still giving a good positive signal over negative one (Blue and green boxes).
