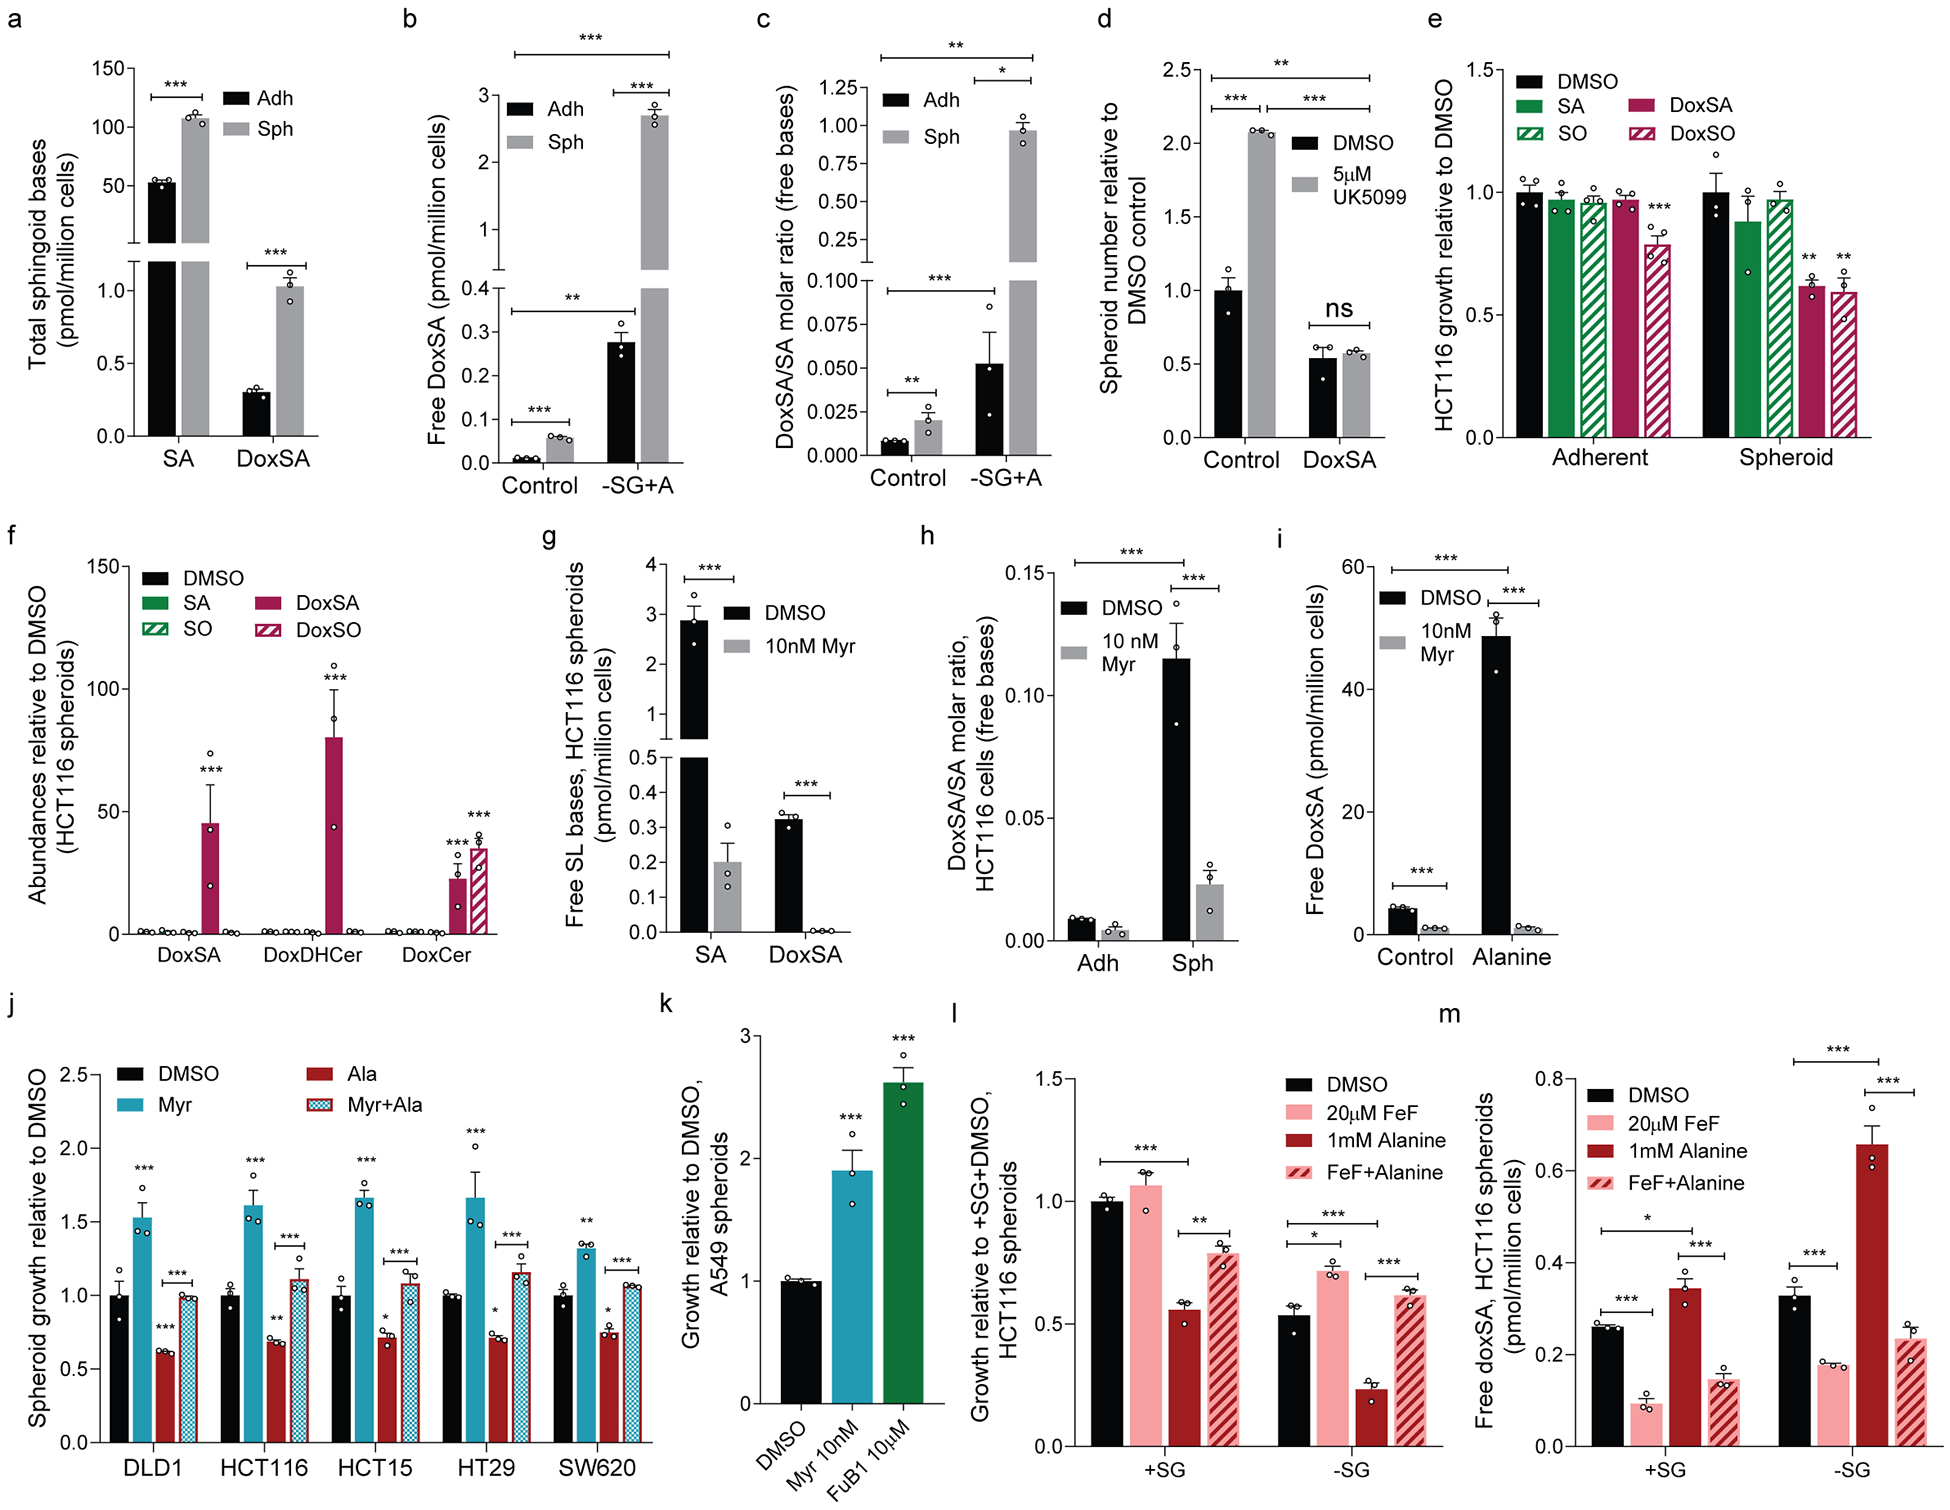
Extended Data Figure 2. 1-deoxysphingolipid synthesis and degradation influence spheroid growth in vitro.

a. Total (hydrolyzed) SA and doxSA abundances in adherent and spheroid cultures of HCT116 cells (n=3 culture wells each).
b. Free doxSA abundances in HCT116 cultures in normal medium or medium without serine/glycine but containing 1 mM alanine (–SG+A) (n=3 culture wells each).
c. DoxSA/SA molar ratio in HCT116 cells in cultures from (b) (n=3 culture wells each).
d. HCT116 spheroid growth in the presence or absence of 10 nM doxSA and treated with vehicle (DMSO) or UK5099 (n=3 culture wells each).
e. Adherent (n=4 culture wells each) and spheroid (n=3 culture wells each) biomass of HCT116 cells treated with vehicle or 50 nM sphingoid bases.
f. Free doxSA, summed doxDHCer and summed doxCer in spheroid cultures from (e) (n=3 culture wells each).
g. SA and doxSA abundances in HCT116 spheroid cultures treated with vehicle or 10 nM myriocin (Myr; n=3 culture wells each).
h. DoxSA/SA molar ratio in HCT116 adherent and spheroid cultures treated with vehicle or 10 nM Myr (n=3 culture wells each).
i. Free DoxSA abundances in HCT116 spheroid cells in the presence or absence of 1 mM alanine and treated with vehicle or 10 nM Myr (n=3 culture wells each).
j. Spheroid growth of cell lines cultured in the presence or absence of 1 mM alanine (red), 10 nM Myr (blue), or both (red outline with checkered blue fill) (n=3 culture wells each condition).
k. A549 spheroid growth under 5 days of culture in Myr or 10 μM fumonisin B1 (FuB1) (n=3 culture wells each).
l, m. HCT116 (l) spheroid growth and (m) free doxSA in the presence (+SG) or absence (–SG) of 0.4 mM serine/serine and treated with DMSO, FeF, 1 mM alanine, or both (n=3 culture wells for each condition).
Two-sided Student’s t-test (a, g), two-way ANOVA (b, c, d, h, i, l, m) or one-way ANOVA (e, f, j, k) was performed for each comparison with no adjustment for multiple comparison. Similar results obtained in 2 (b-e) or 3 (a, g-i) independent experiments. Data represented as mean ± s.e.m. *P<0.05, **P<0.01, *** or # P<0.0001.
