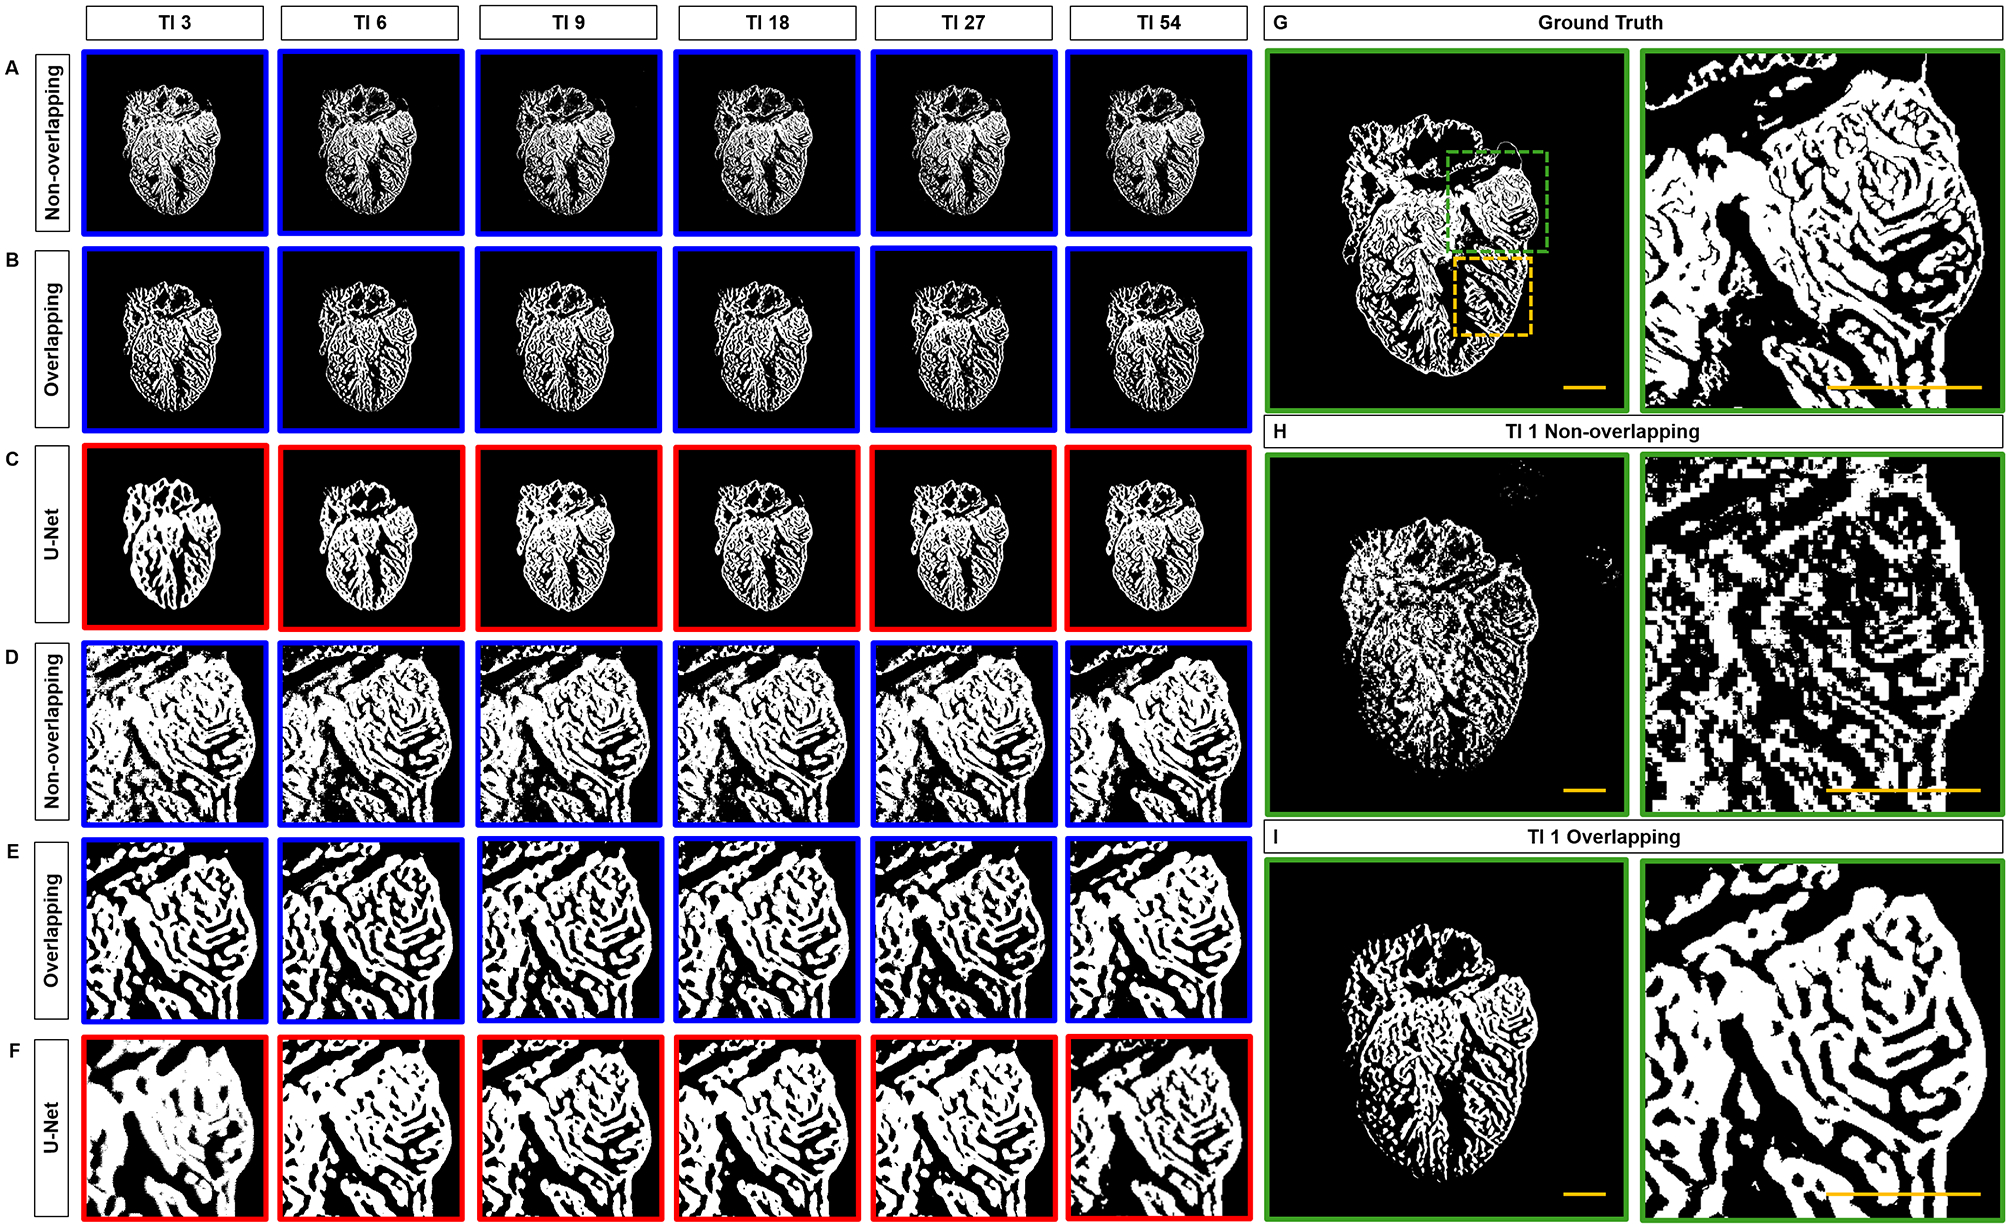
Fig 3.

Comparison of Segmentation results. (A) Non-overlapping and (B) overlapping patches to generate Saak coefficients. (C) Under the same 3, 6, 9, 18, 27 and 54 training images, the trabecular network is better demarcated by Saak transform than by U-Net. (D-F) Comparison of trabecular network in the region of interest (dashed square in G) further supports the capacity of Saak transform to reveal the detailed trabecular network. (H-I) The results of 1 training-based image are compared to the (G) ground truth. TI: training image. Scale bar: 200 μm.
