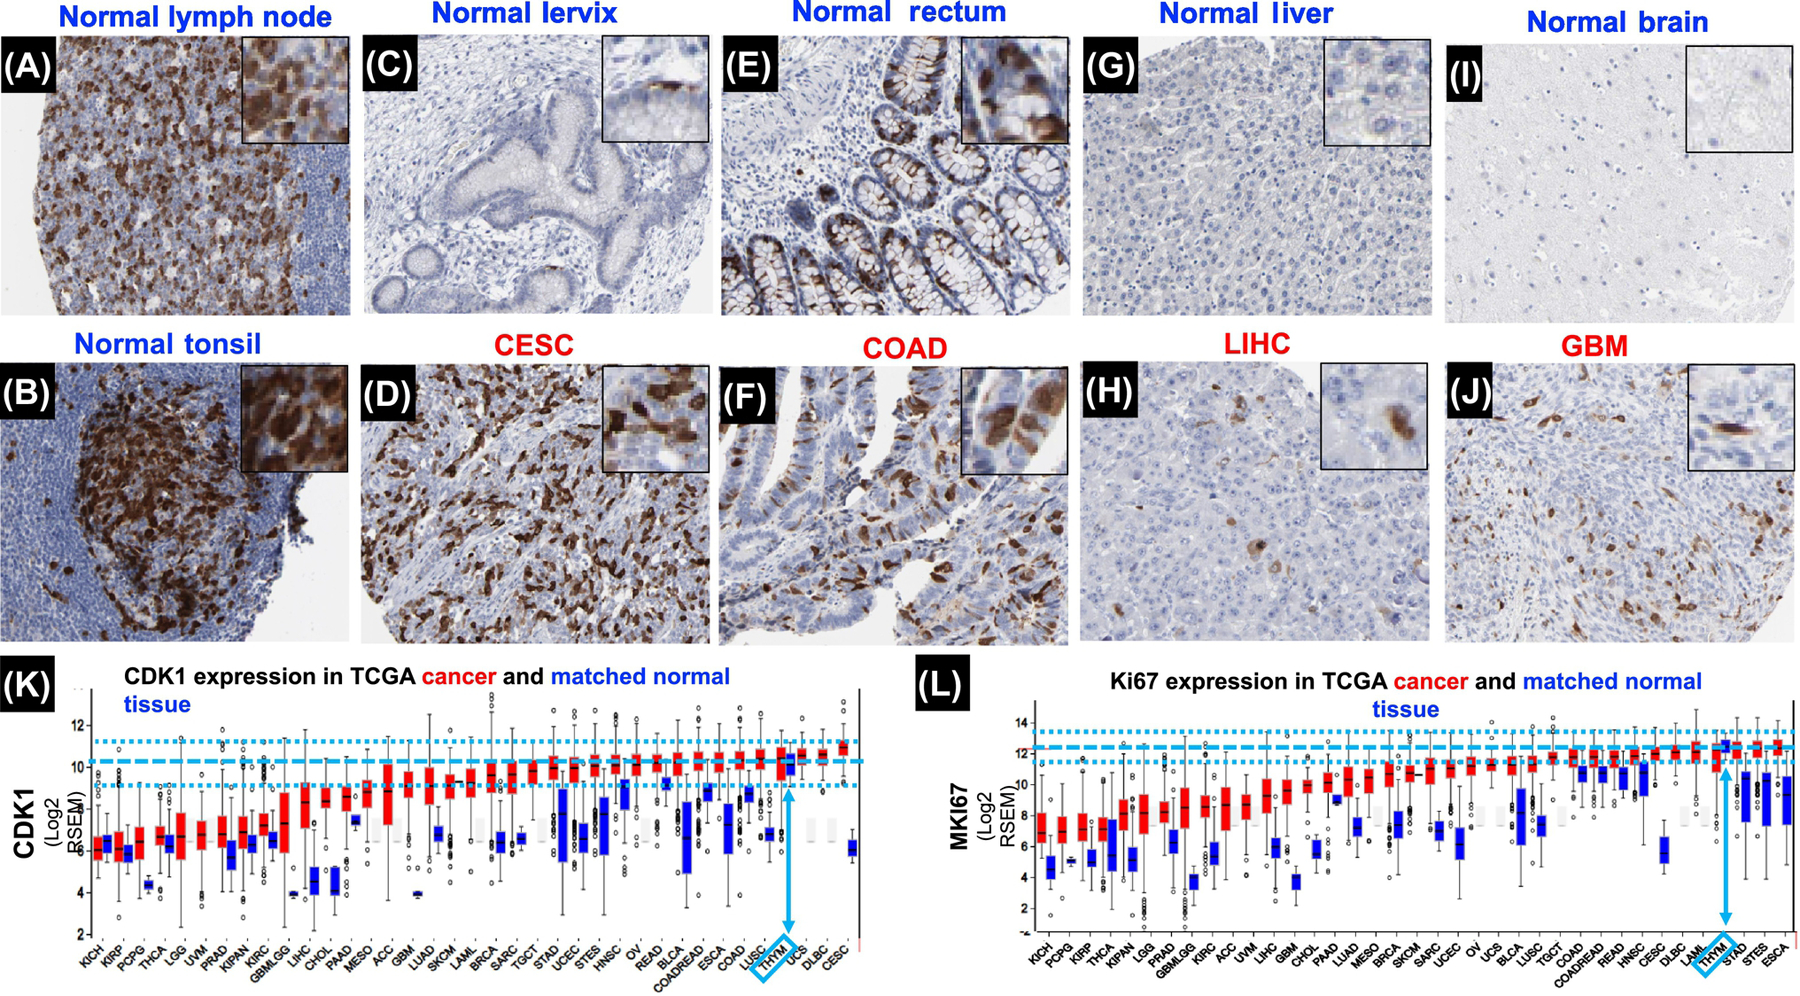
Figure 2: The mitotic rates of fast-growing normal tissues are higher than that of most tumors.

Immunohistochemistry (IHC) images compiled from the Human Protein Atlas show various normal and cancerous tissue were DAB-stained for CDK 1 [72] (antibody CAB003799) and counterstained with hematoxylin (blue, nuclei). CDK1 is only expressed during the G2/M and M phases and thus provides a simple representation of mitotic cells (Wolowiec et al. Int. J. Cancer 1995, Xi et al. Tumor Biol. 2015). Positively stained nuclei (brown) indicate a mitotic cell while non-stained cells (blue) are non-mitotic. A magnified view of strongly stained regions can be found in the top right corner of each image. A: Normal lymph node, germinal center (Patient ID: 1636), B: Normal tonsil (Patient ID: 2511); C: Normal Cervix (Patient ID: 2005), D: CESC, cervical squamous carcinoma, (Patient ID: 1751), E Normal rectum, (Patient ID: 2001); F, COAD, Colorectal adenocarcinoma (Patient ID: 2096); G: Normal liver (Patient ID: 1899); H: LIHC, liver hepatocellular carcinoma (Patient ID: 2325); I: Normal brain (Patient ID: 2521); J: GBM, glioblastoma (Patient ID: 1572).
Note the near absence of CDK1-postive in most normal tissues (C, G, I) and the high expression of CDK1 and Ki67 in tumors compared to matched normal tissues (K, L, red versus blue bars). In fact, strong positive staining is common in the germinal centers of hemopoietic tissues (A, B) and in the colorectal epithelium (E) compared to the cancerous tissues shown here (D, F, H, J). It is important to recall that highly proliferative cancers are not necessarily synonymous with the deadliest cancers. For example, CESC has a much higher proliferative index than LIHC or GBM yet the prognosis of the former is much better than in the latter.
K. RNA-Seq data for CDK1 from the TCGA Firebrowse concur with the qualitative mitotic indices obtained from the IHC images shown. Here, mRNA expression serves as a good approximation of proliferation, as CDK1 is only expressed during the M-phase. Bars (red, tumor; blue, normal control) represent mRNA expression (median, first and third quartiles, and 95% CI) of primary human tumors sequenced from diverse cancers in the TCGA.
mRNA expression of the thymus (bone marrow was not available), a representative hemopoietic tissue, is highlighted in light blue arrows, with the median and 95% CI indicated as light blue dashed lines. Overall, most cancers have lower expression of CDK1 compared to normal thymus, which concurs with the IHC data. L. RNA-Seq data for Ki67 from the TCGA Firebrowse follows a pattern similar to CDK1, with the majority of tumors having a much lower expression compared to normal hemopoietic tissues such as the thymus, indicating slower proliferation.
