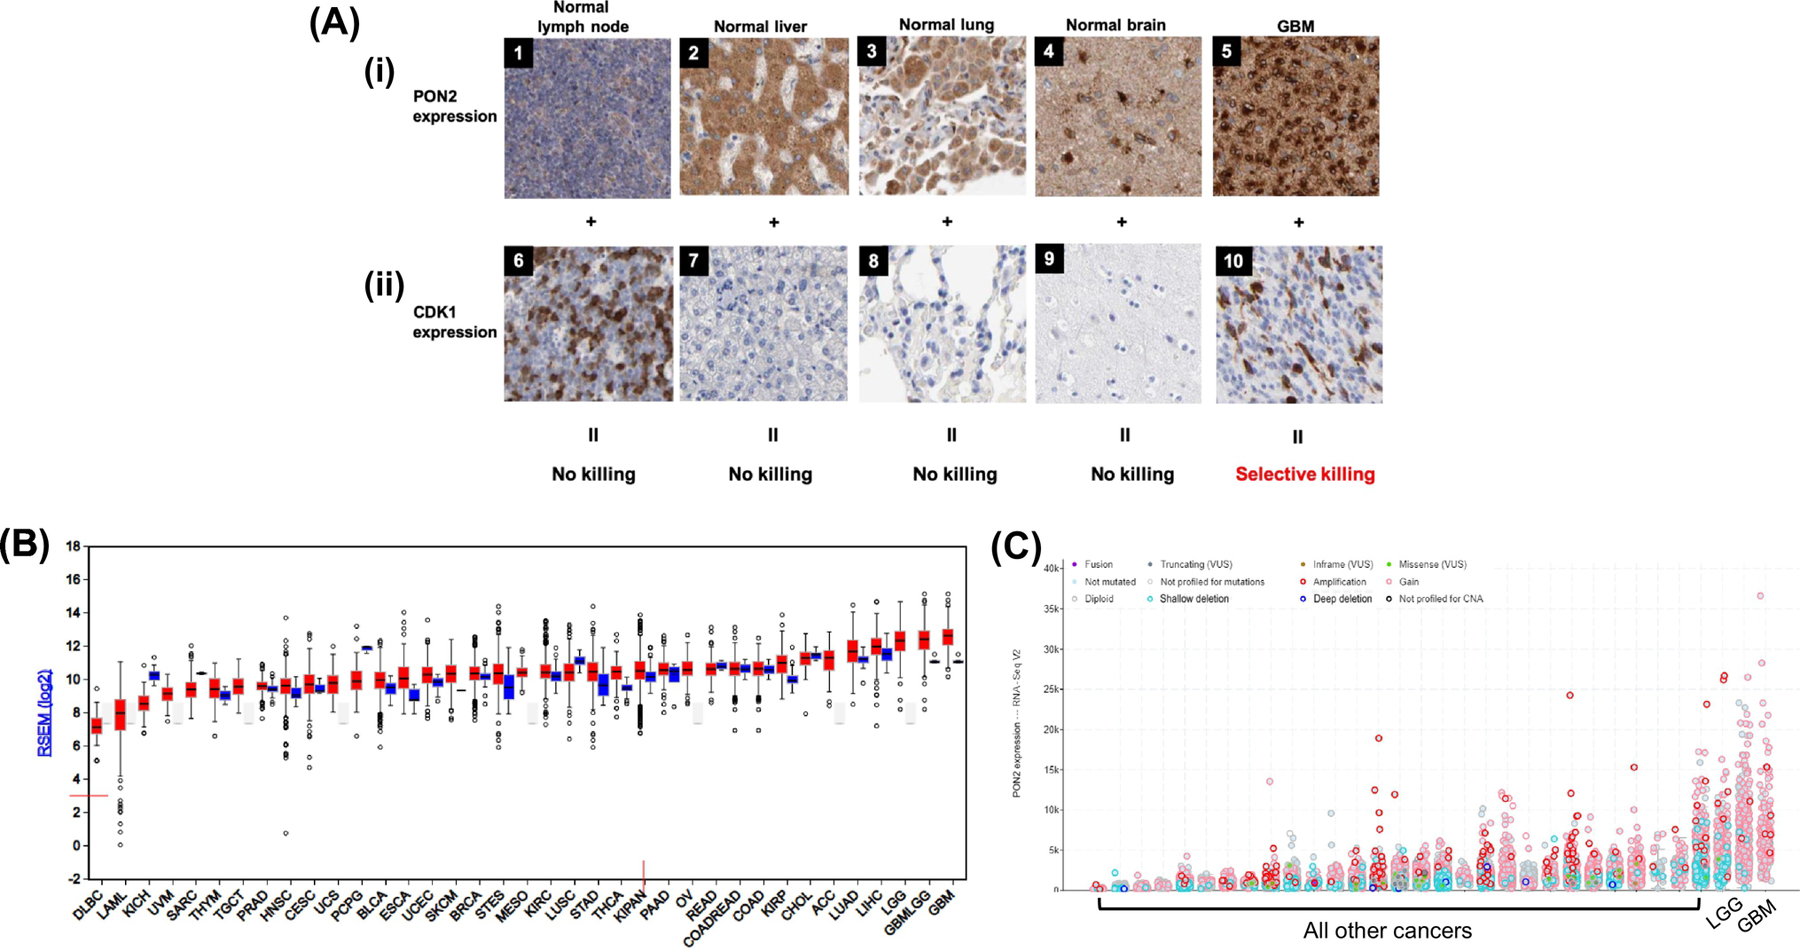
Figure 6. A PON2 bioactivated CDK1 inhibitor pro-drug only kills cells that express both enzymes.

IHC images compiled from the Human Protein Atlas show normal and cancerous tissue DAB-stained for PON2 (antibody HPA029193) and CDK1 (antibody: CAB003799). Top row: Positively stained cells (brown) indicate the expression of PON2 while negatively stained cells (blue) indicate the absence of PON2. Bottom row: Positively stained nuclei (brown) indicate the expression of CDK1 while negatively stained nuclei (blue) indicate the absence of CDK1. Though PON2 expression is high in both normal brain tissue (4, Patient ID: 1609) and in GBM (5, Patient ID: 2843), CDK1 is only expressed in GBM (10, Patient ID: 1578) and not in the normal brain (9, Patient ID: 2521). Pro-drug activation by PON2 in non-malignant brain cells to release the mitotic kinase inhibitor is thus of no consequence to normal brain cells. Similarly, normal liver (2, Patient ID 3222) and lung cells (3, Patient ID 2268) exhibit high levels of PON2 but do not express CDK1 (7, 8, Patient IDs: 1846, 2417). For comparison, CDK1 is highly expressed in proliferative, normal cells such as in the lymph node (6, Patient ID: 1636) but PON2 is not expressed at notable levels (1, Patient ID: 1724). B. RNA-Seq data for PON2 from the TCGA Firebrowse concur with the qualitative mitotic indices obtained from the IHC images shown. Bars (red, tumor; blue, normal control) represent mRNA expression (median, first and third quartiles, and 95% CI) of primary human tumors sequenced from diverse cancers in the TCGA. C. RNA-Seq data with copy number analyses for PON2 across various cancers adapted from TCGA cBioPortal. Amplifications (red circles) and gain-of-function mutations (pink circles) in PON2 are only elevated in GBM and LGG.
