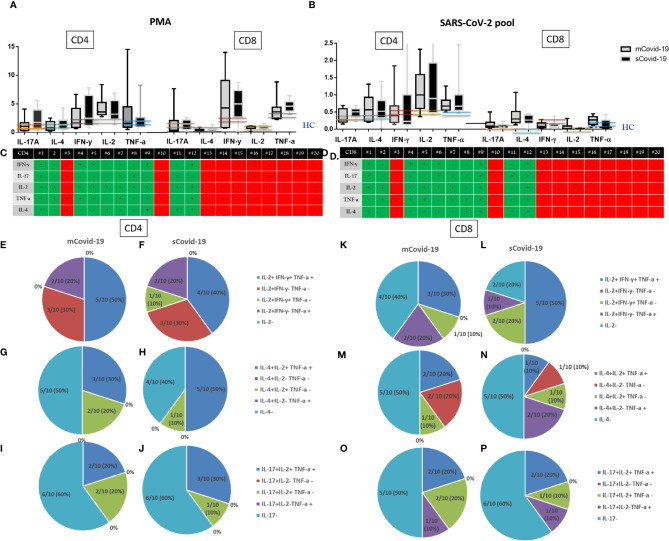
Figure 4.
T-cell cytokine secretion upon phorbol myristate acetate (PMA)/ionomycin, and Sars-Cov-2 challenge: Severe Covid-19 (sCovid-19) vs mild Covid-19 (mCovid). Peripheral blood mononuclear cells (PBMCs) were isolated from blood samples of unselected 20 COVID-19 patients (n = 10 sCovid-19 and n = 10 mCovid-19). PBMCs were incubated for 16 h with SARS-CoV-2 spike (S)-, membrane (M)-, and nucleocapsid (N)-protein peptide pools and analyzed with flow cytometry. (A, B) Frequencies of interferon-γ (IFN-γ)−, tumor necrosis factor-α (TNF-α)−, interleukin (IL)-2−, IL-4−, and IL-17A producing antigen-specific CD4+ and CD8+ T-cells upon (A) Phorbol myristate acetate (PMA) and ionomycin, (B) Sars-Cov-2 pool. In each graph, the columns represent the median values, while the error bars indicate the 10th–90th percentile range. Frequencies were corrected by background subtraction as determined in non-stimulated controls. Dotted lines indicate the median levels of healthy controls (HC) from archived material. No major differences in CD4 and CD8 cytokine productions were observed between mCovid-19 and sCovid-19. Comparison between groups (sCovid-19 vs mCovid-19) Mann–Whitney test. (C, D) Tables represent the total production of different cytokines for all enrolled patients. Green boxes represent mCovid-19 patients, and red boxes represent sCovid-19 patients. (E–P) Composition of bi- and trifunctional CD4+ and CD8+ T-cells after stimulation with Sars-Cov-2 pool. The fraction of positive subsets (above 90th percentile of healthy controls) of all bi- or trifunctional cells was calculated for each combination of cytokine. Colored lines indicate 90th and 10th percentile ranges of healthy controls.

