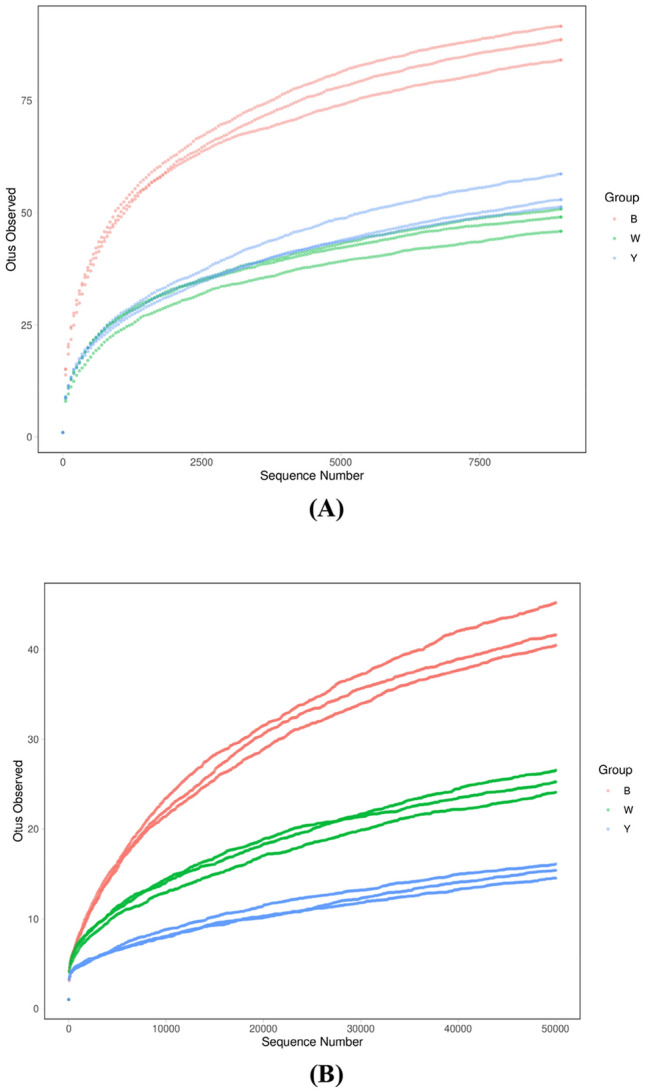
Fig. 1.

The rarefaction curves. a Bacteria, and b Fungi. B black Daqu sample, W white Daqu sample, Y yellow Daqu sample. Each sample has three parallels based on the number of OTUs. The curves are close to equilibrium, indicating the representativity of the Daqu samples
