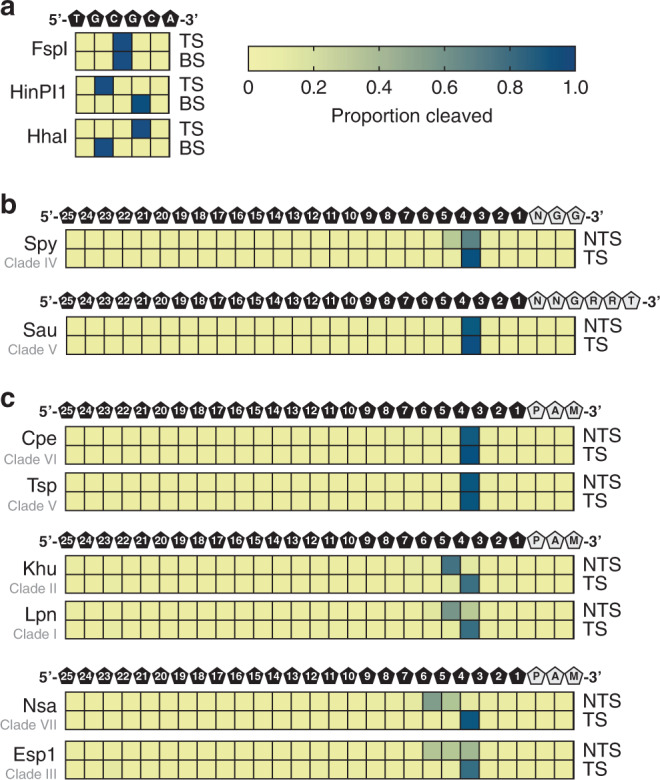
Fig. 5. Target DNA cleavage patterns produced by Cas9 orthologs.

Cleavage sites and resultant double-stranded DNA (dsDNA) ends are depicted as heatmaps that show the proportion of cleaved ends recovered by DNA sequencing at each position of a target DNA. The intensity of the blue color indicates the proportion of mapped cleavage ends. a Control digests using restriction enzymes showed that blunt ends, 5′-overhangs and 3′-overhangs might be recovered with our approach. TS indicates the top strand; BS indicates the bottom strand. b Spy Cas9 and Sau Cas9 cleaved DNA ends. Heatmaps represent mapped cleavage ends as the averages at each position in five different dsDNA targets. The position of the DNA bases and protospacer adjacent motif (PAM) sequences is depicted above the heatmaps. NTS indicates a non-target strand; TS indicates the target strand. c Blunt and staggered-end cleavage. Examples of blunt, one base 5′-overhang staggered cleavage, and multiple base 5′-overhang cleavage are depicted as heatmaps that show the proportion of cleaved ends as the averages at each position in five different dsDNA targets. The position of the DNA bases and PAM sequences is depicted above the heatmaps. NTS indicates a non-target strand; TS indicates the target strand. Source data are provided in Supplementary Data 5.
