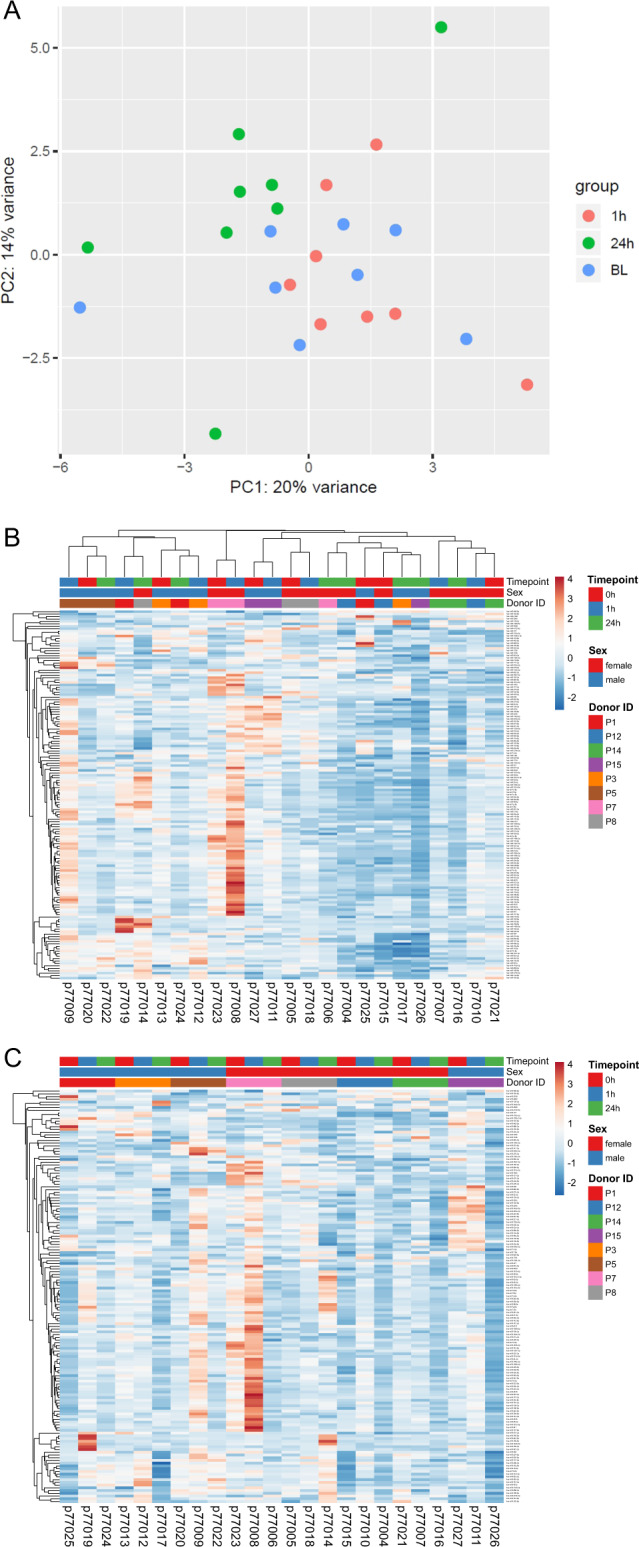
Fig. 1. Unsupervised data analysis.

a Principal component analysis (PCA) highlights microRNA patterns observed in subjects at baseline (BL), 1 and 24 h after parabolic flight. Data from 213 circulating microRNAs detected in all 24 samples by small RNAseq was used (regularized log tags per million data). The first and second principal component explain 20 and 14% of the variance, respectively. b Expression heatmap with unit variance scaling applied to rows (microRNAs). Both rows and columns are clustered using correlation distance and average linkage. Pearson correlation was used as correlation distance. c Expression heatmap with unit variance scaling applied to rows (microRNAs). Only rows are clustered using Pearson correlation as measure of distance and average linkage.
