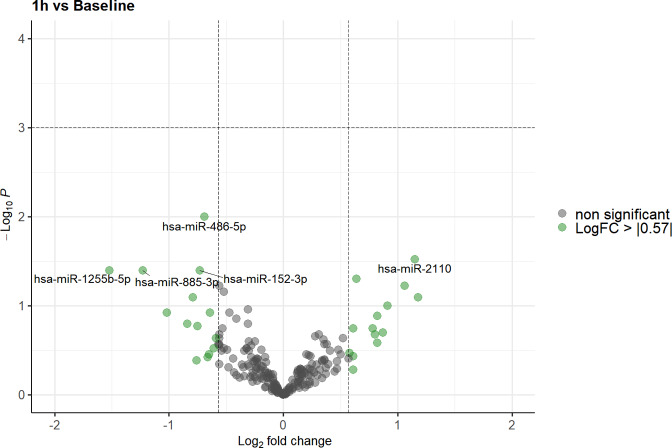
Fig. 2. Volcano plot illustrating the effect of gravitational changes on serum levels of 213 miRNAs detected and quantified by next-generation sequencing.
Plot depicts the relation between unadjusted p-value (y-axis, −log10 transformed) and effect size (x-axis, log2 transformed fold change) for serum microRNA of subjects at 1 h compared to baseline. MicroRNAs with a log2 fold change > 0.57 (1.5 fold linear change) are indicated in green. MicroRNAs with an adjusted p-value (FDR) of < 0.05 are highlighted in red. FDR false discovery rate.

