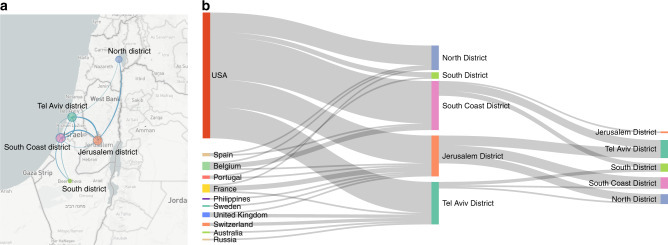
Fig. 4. Spread of SARS-CoV-2 into and within Israel.
a Map of Israel with geographic locations of samples, and inferred spread inside Israel (blue lines). Figure generated using NextStrain32. b Inferred viral spread into and inside Israel, with directionality (left to right). Each line represents a transmission event inferred based on the phylogeny. Thicker lines indicate multiple transmission events. Source data are provided as a Source Data file.

