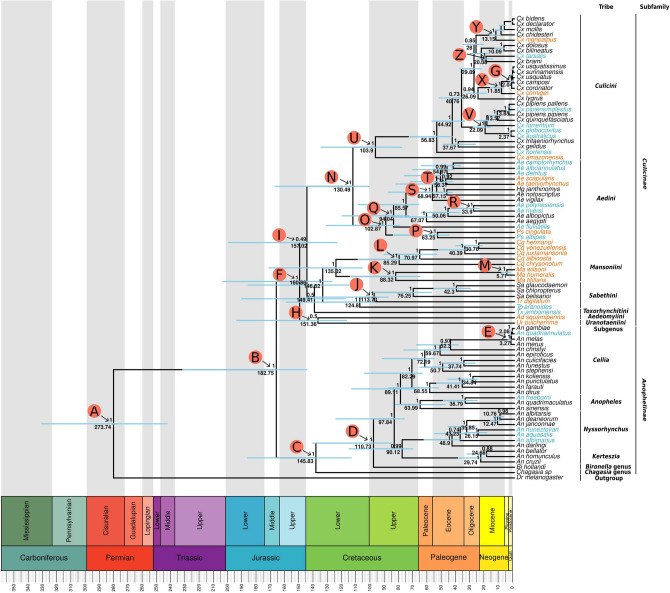
Figure 3.
Evolutionary timescale of Culicidae family. Tree was generated from BEAST using PCGs nucleotide sequences partitioned by gene and codon positions (1st + 2nd and 3rd separately). Blue bars represent the HPD95%. The numbers above and below the bars show the posterior probability and the predicted median dating respectively for each node. Specific words inside the circles represent the nodes discussed in the text. Light blue tip names represent mitogenomes characterized from SRA data. Orange tip names represent sequenced mitogenomes from this study.

