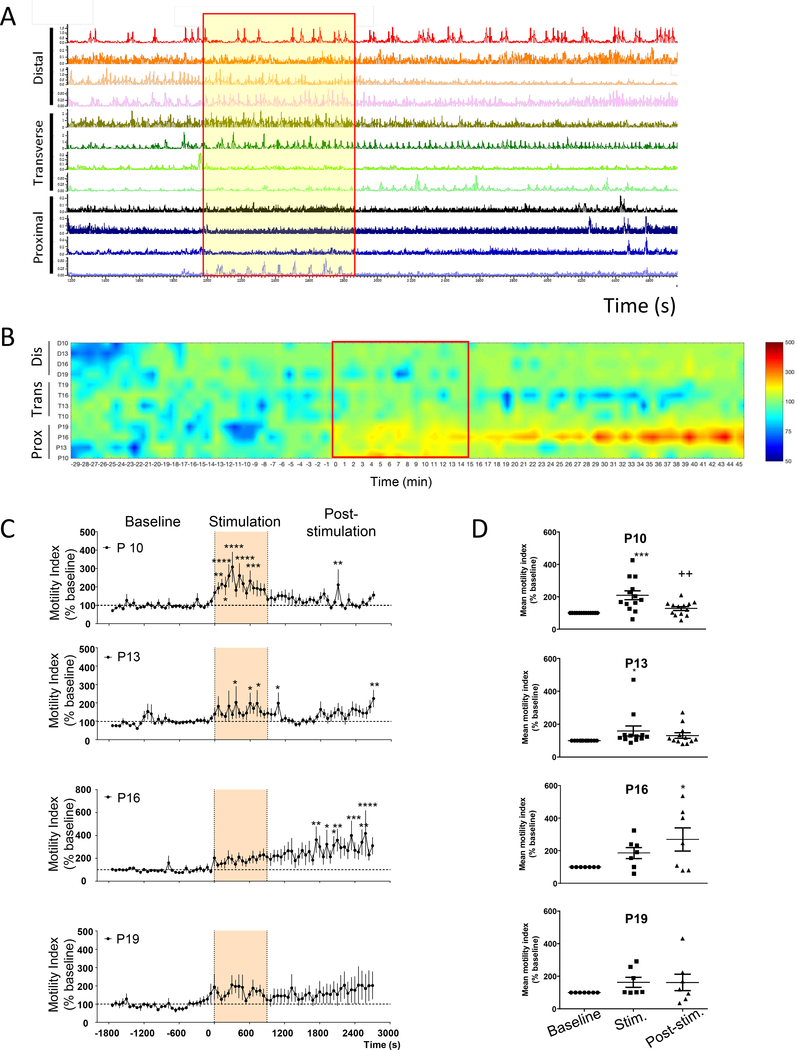
Figure 2. Influence of direct proximal colon electrical stimulation.
(10 Hz, 2 ms, 15 mA, pulse train protocol) as monitored by manometry in anesthetized pigs (n=7–15 each). A) Representative trace of direct proximal colon stimulation; B) Pressure map representation; C) Time course response of the motility response recorded by the different proximal probes (P10, P13, P16, P19) at basal, during and post direct proximal colon electrical stimulation (motility index, % baseline) (n=7–13). Traces show the baseline response (30 min), stimulation (15 min) and post stimulation (30 min) periods. Data are mean ± SEM, 2-way ANOVA and Bonferroni’s post hoc test, *p<0.05, **p<0.01, ***p<0.001, ****p<0.0001 vs baseline. D) Mean motility index change (% baseline) during baseline (30 min), stimulation (15 min) and post stimulation (30 min) in proximal (n=7–13 pigs) regions. Data are mean ± SEM, repeated measures one-way ANOVA and Tukey’s post hoc test, *p<0.05, ***p<0.001 vs baseline, ++p<0.01 vs stimulation. Channels represent the position of the different manometry probes in the different colonic parts (P: proximal, T: transverse and D: distal).

