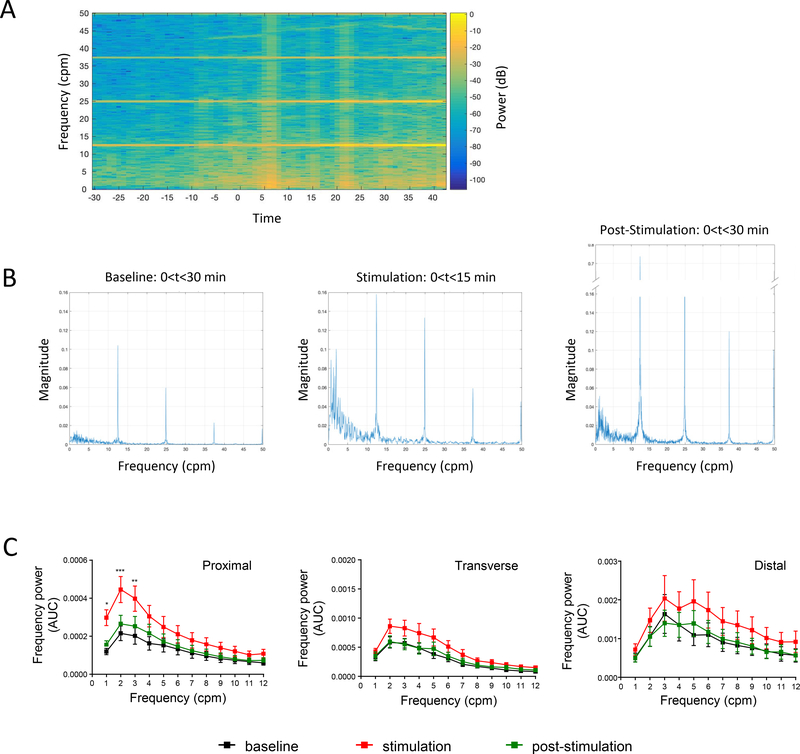
Figure 3. Influence of direct proximal colon electrical stimulation on the regional colonic frequency power spectrum.
A) Representative spectrogram of the proximal colon frequency power spectrum in an anesthetized male Yucatan minipig in response to direct proximal colon electrical stimulation (10 Hz, 2 ms, 15 mA, pulse train protocol). Note that most of the frequency power comes from the ~0–12 cpm band B) Representative periodogram showing dominant frequency band (~1–6 cpm) during baseline, stimulation and post stimulation periods. Note that the power of the 1–6 cpm band is increased during stimulation and post-stimulation periods. Note also (in A and B), the breathing artifact and its harmonic waves are straight and stable. Breathing artifact (~12.5 cpm in this example) is the original frequency. The harmonic waves (~25, 37.5, 50 cpm in this example) represent artifact frequency that is a positive integer multiple of the frequency of the original wave (breathing artifact). C) Aggregated data on frequency power spectrum in the proximal, transverse and distal colon in response to direct proximal stimulation (cumulative recordings from 4 probes per colonic region in n=7–15 pigs). Direct ES of the proximal colon increased the power of the 1–12 cpm frequencies in all regions with a statistical significant difference in the 1–3 cpm frequencies in the proximal colon. Data are mean ± SEM, repeated measures two-way ANOVA and Sidak’s post hoc test, * p<0.05, ** p<0.01, *** p<0.001, vs baseline in respective groups.

