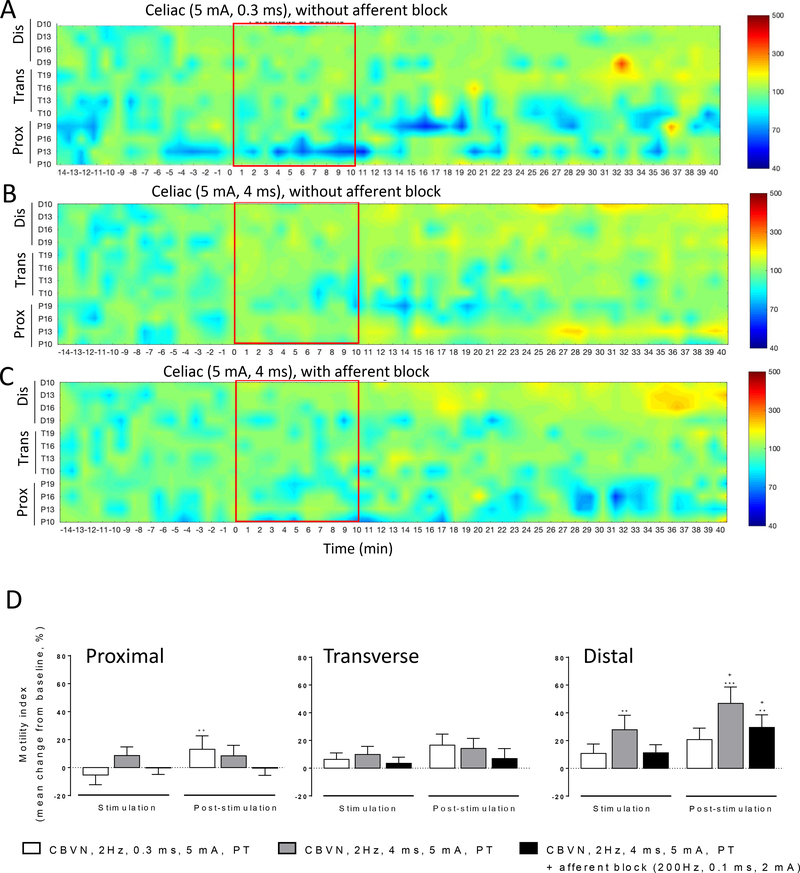
Figure 6. Influence of different protocols of electrical stimulation of the abdominal vagus nerve, celiac branch on colonic motility in anesthetized pigs.
Pressure map of A) pulse train, 2 Hz, 0.3 ms, 5 mA, 10 min, without anodal block; B) pulse train, 2 Hz, 4 ms, 5 mA, 10 min, without anodal block; C) pulse train, 2 Hz, 4 ms, 5 mA, 10 min, with afferent anodal block 200 Hz, 2 ms, 0.1 mA. Channels represent the position of the different manometry probes in the different colonic parts (P: proximal, T: transverse and D: distal). Traces show the baseline response (15 min), stimulation (15 min) and post stimulation (30 min) periods. Data are mean ± SEM of recordings from n=7–14 pigs. D) Motility index changes (mean change from baseline %) in response to celiac branch vagus nerve stimulation (2 Hz, 5 mA) at pulse width of 0.3 ms (white bars), 4 ms (grey bars) and 4 ms with anodal block (black bars), during the stimulation (15 min) and post stimulation (30 min) in proximal, transverse and distal (n=7–14) regions. Data are mean ± SEM, Wilcoxon paired or Mann-Whitney unpaired t tests, *p<0.05, **p<0.01 vs baseline, +p<0.05 vs stimulation in respective groups.

