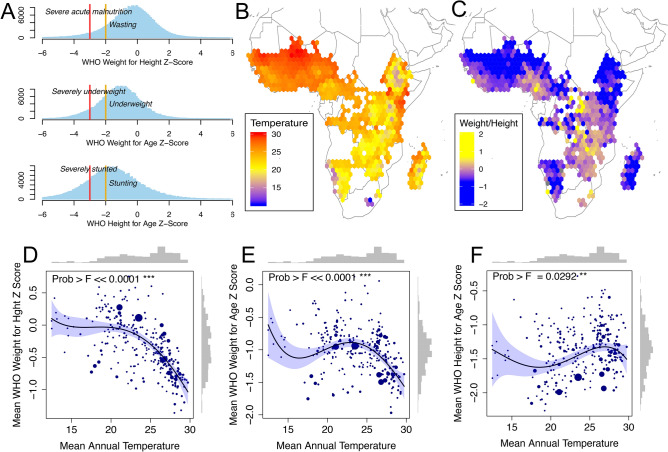
Figure 1.
Average temperature and child anthropometric outcomes. (A) Distribution of child WHO weight and height measures in sample, weighted using DHS sample weights to be representative at region-by-survey level. WHO wasting, underweight, and stunting thresholds shown for moderate (yellow, − 2) and severe (red, − 3) cases. (B) Spatial variation in 50-year average temperature and (C) average child weight-for-height for gridded 1.5 * 1.5 bins of latitude and longitude. (D–F) Sub-national regional (admin level 1) correlation between average (50 years) regional temperature and average anthropometric measures for children surveyed in that region. A fourth-order polynomial is fitted to the data, weighted by number of observations (proportional to dot size). The F-statistic for the polynomial fit is shown along with histograms of the distribution of the data.

