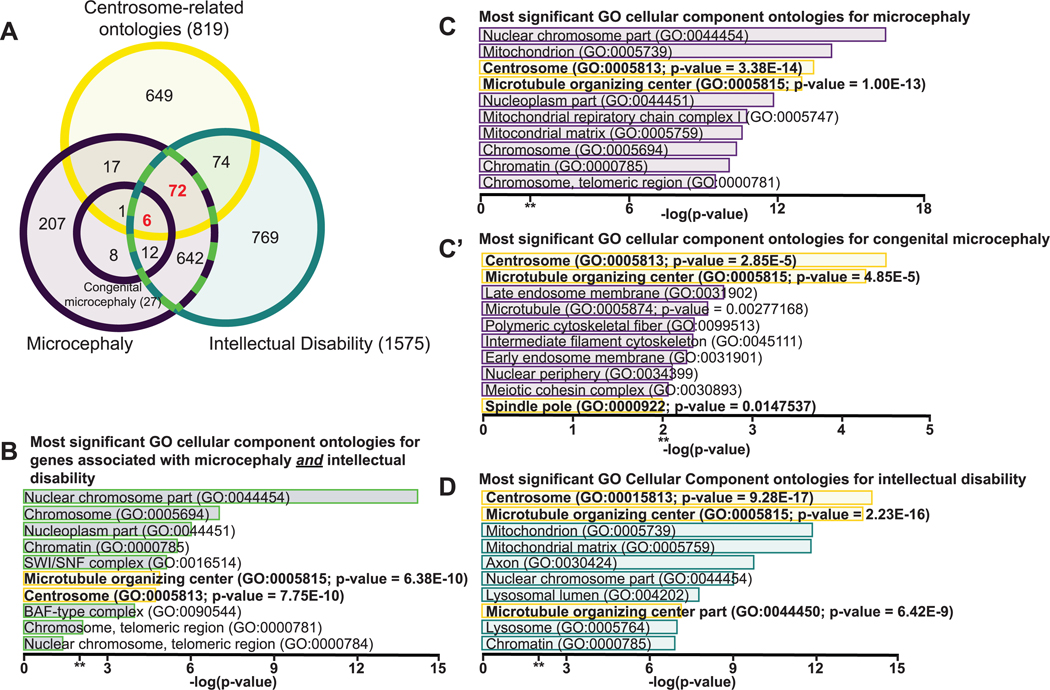
Figure 1. Microcephaly associated genes are significantly enriched with centrosome genes.
(A) Venn-diagram depicts curated gene lists and overlap indicates the number of common genes present within each data set. A gene list curated by HPO indicates 1575 human genes are associated with intellectual disability (term HP:0001249; blue circle) and 965 human genes are associated with microcephaly (term HP:0000252; purple circle). Of these genes, 27 are also associated with congenital microcephaly (term: HP:0011451; purple circle inset). A gene list generated by combining all genes annotated with the following centrosome-related cell component ontology IDs curated by the Gene Ontology Resource: centrosomes (GO: 0005813), microtubule-organizing centers (GO: 0005815), and spindle pole (GO:0000922) contains 819 unique genes (yellow circle). The microcephaly phenotype and intellectual disability phenotype share 732 genes (dotted green outline). This overlap accounts for ∼75% of the microcephaly data set and ∼45% of the intellectual disability data set, indicating neurodevelopmental convergence between the neuroanatomical and behavioral phenotypes. Of the genes associated with microcephaly, 96 overlap with genes annotated with centrosome-related ontologies. Of the genes associated with intellectual disability, 152 overlap genes annotated with centrosome-related ontologies. The microcephaly and intellectual disability data sets share 78 common centrosome-related genes (red), representing ∼10% of the shared disease genes, indicating enrichment of the centrosome and centrosome-related cell components with both diseases. (B–D) Bar graphs show the most significant cellular components enriched in each data set as determined by Enrichr. P-values are displayed for centrosomes and centrosome-related cellular components (bolded text). (B) GO-cellular component analysis reveals that the centrosome and microtubule-organizing center are enriched among genes overlapping with both the microcephaly and intellectual disability phenotype data sets. (C) GO-cellular component analysis reveals that the centrosome and microtubule-organizing center are among the top five significantly enriched cellular components in the microcephaly gene data set. (C′) GO-cellular component analysis reveals that the centrosome and microtubule-organizing center are the most significantly enriched cellular components in the congenital microcephaly gene data set. (D) GO-cellular component analysis reveals that the centrosome is the most significantly enriched cellular component in the intellectual disability gene data set; **, P = 0.01.

