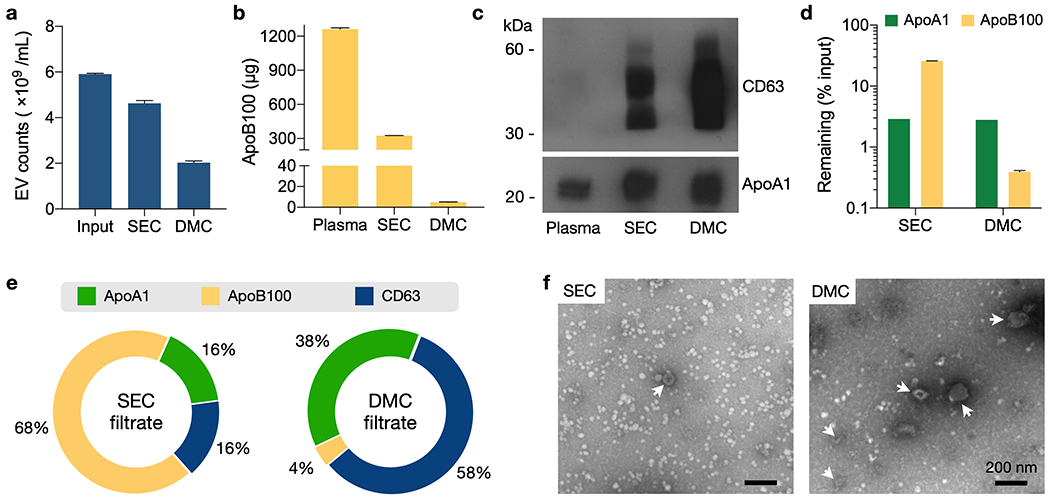
Fig. 2. DMC characterization.

(a) EV recovery was estimated using samples with a known number of cell-line derived EVs in PBS (input). Equal amount of samples were passed through a SEC or DMC column, and particle numbers after preparation were measured via nanoparticle tracking analysis (NTA). Recovery ratios were 78% (SEC) and 34% (DMC). Data from technical triplicates are displayed as mean ± s.d. (b) DMC and SEC columns were used to process mock clinical samples which were human plasma spiked with cell-line derived EVs. Most ApoB1 proteins were removed by DMC. Data from technical duplicates are displayed as mean ± s.d. (c) The same amount of plasma and EV sample proteins from (b) were analyzed. ApoA1 levels were comparable between SEC and DMC. CD63 was significantly enriched in DMC samples. (d) Capacity for LPP removal by DMC and SEC were compared. ApoA1 (HDL) and ApoB100 (VLDL and LDL) contents were measured before and after filtration of human plasma (0.5 mL). Both DMC and SEC showed a similar efficiency (~97%) in ApoA1 depletion. For ApoB100 removal, DMC (efficiency: 0.4%) significantly outperformed SEC (25%). Data from technical duplicates are displayed as mean ± s.d for ApoB100. ApoA1 quantification was based on band intensity from Western blotting. (e) Relative mass-ratios of ApoA1, ApoB100, and CD63 were estimated in SEC and DMC filtrates. (V)LDL was the major vesicle population in the SEC filtrate, whereas EVs were the dominant component in the DMC-prepared sample. (f) Transmission electron micrographs of SEC- and DMC-prepared human plasma. EVs (arrowheads) were negatively stained; LPPs appeared white. Note LPP reduction and EV enrichment in the DMC sample. Close-up images are provided in Figure S2.
