
Figure 2.
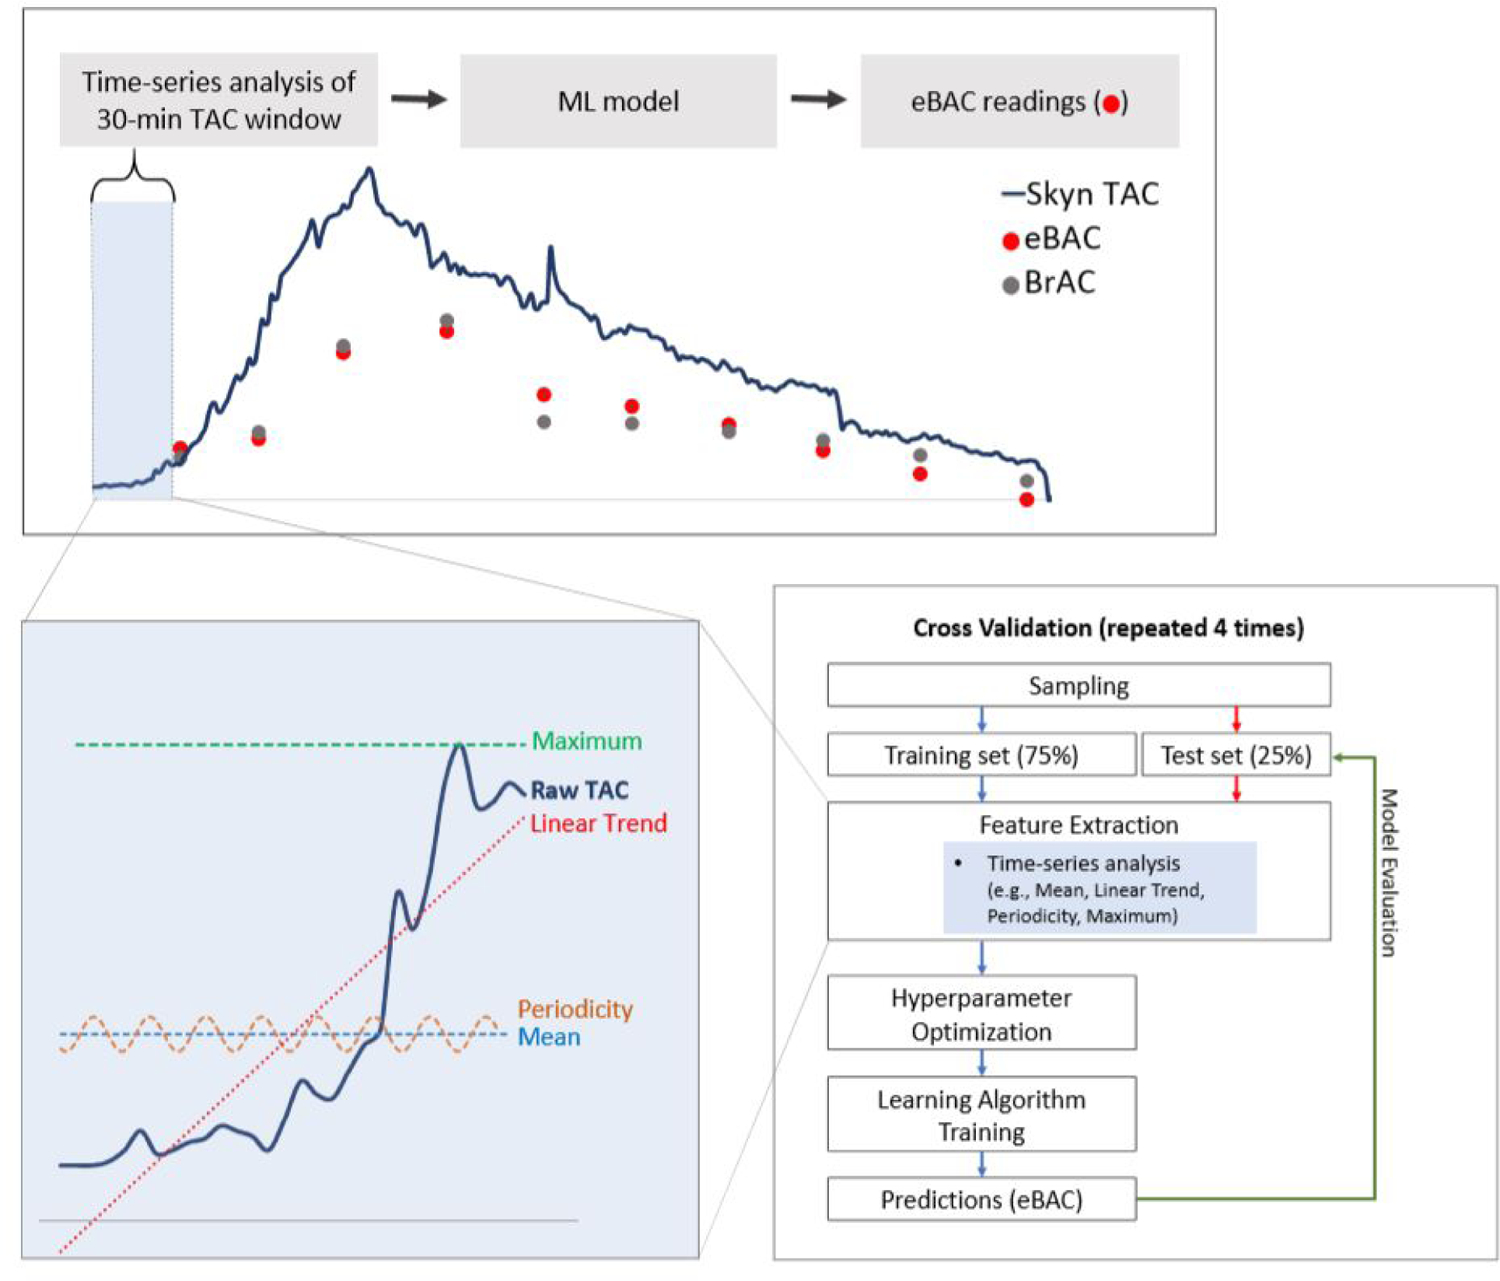
A visual representation of the data analysis plan employed in the current project. Data analysis involved the extraction of multiple time series features (e.g., mean, trends, periodicity) from the 30 minutes of raw TAC data that preceded each breathalyzer (BrAC) reading. These time series features were then entered as predictors into Extra-Trees machine learning algorithms to create estimates of BrAC from transdermal data (eBrAC). The top panel provides a broad visual depiction of the entire analysis process, the bottom left panel provides examples of a subset of time series features extracted (see Table 1 for additional features), and the bottom right panel provides a flow chart of machine learning modeling procedures.