
Figure 3.
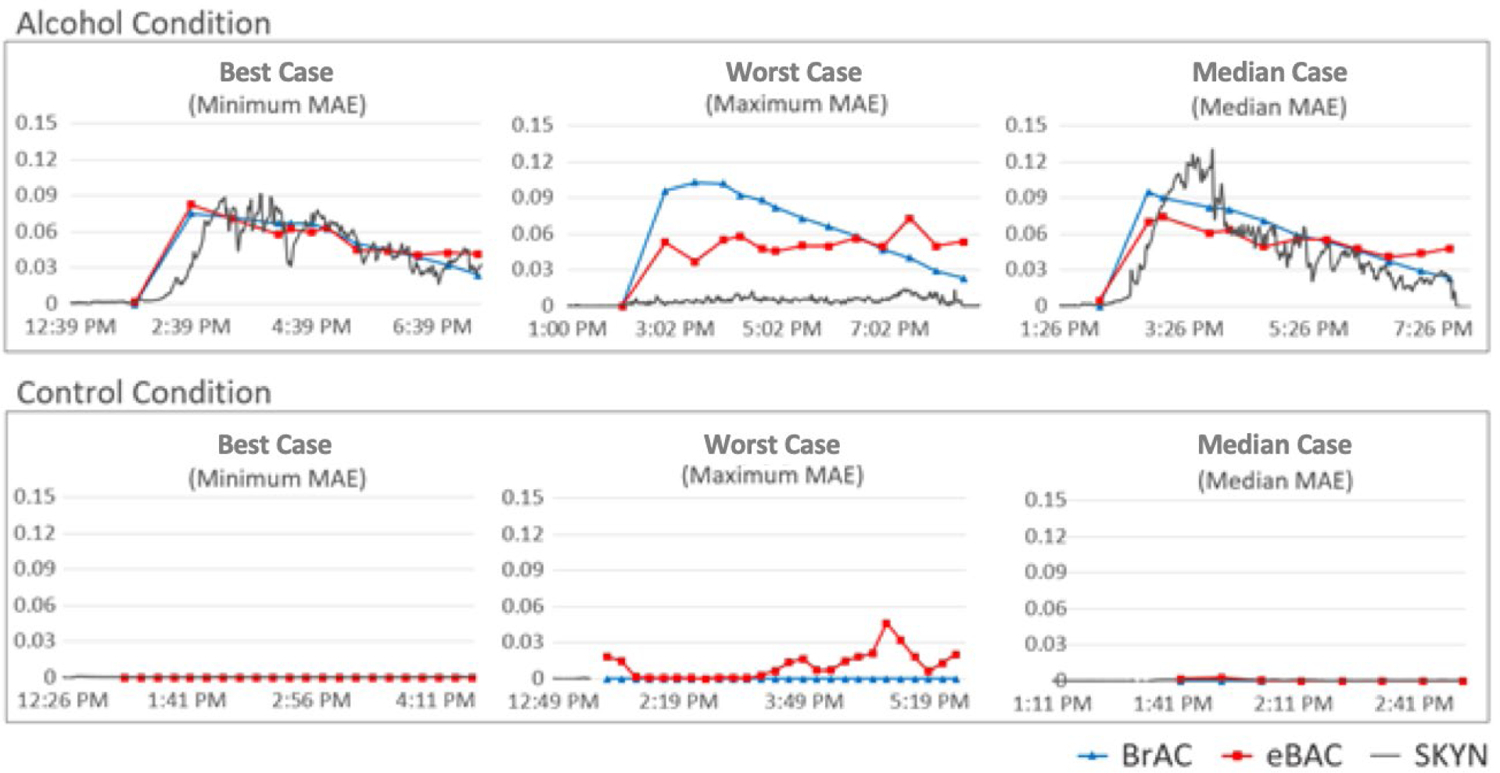
Graphs for participants with the “best” (minimum MAE), “worst” (maximum MAE), and average (Median MAE) prediction accuracy from both alcohol and no-alcohol (control) conditions in the current study. Precise average MAEs for alcohol condition graphs shown above are as follows: best case MAE=0.006; worst case MAE=0.028; median case MAE= 0.013. Precise average MAEs for the no-alcohol (control) condition graphs are as follows: best case MAE=0.000; worst case MAE=0.011; median case MAE=0.001. Baseline standardization procedures were applied to all Skyn data, as described in the Data Analysis Plan. For the purposes of graphs displayed here, data from Skyn was transformed (divided by 20,000) such that it could be visualized on approximately the same scale as eBrAC and BrAC.