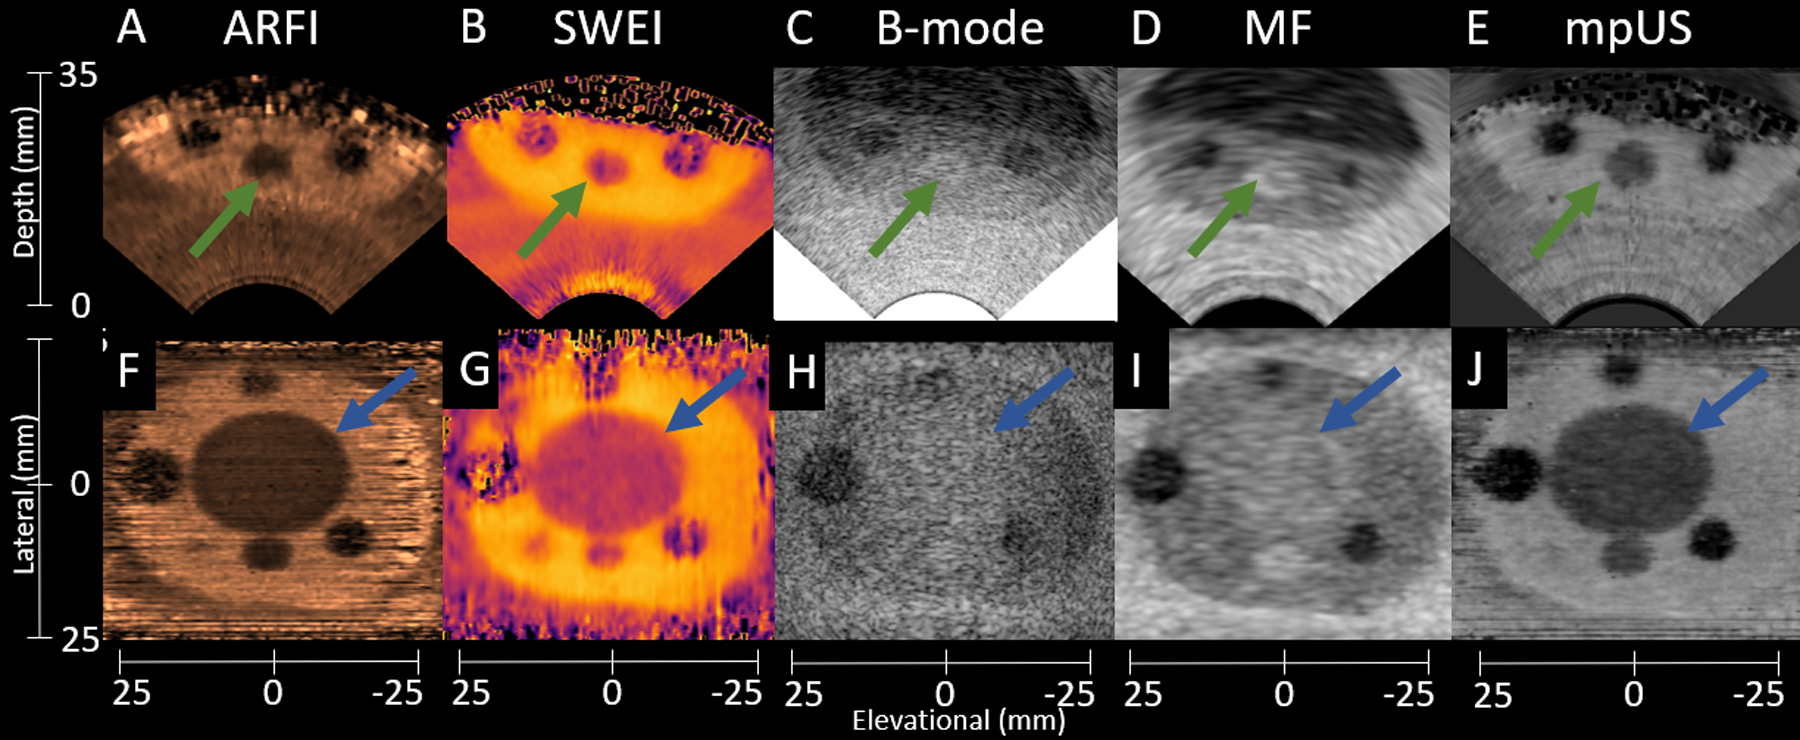
Figure 5:

Sample axial (A-E) and coronal (F-J) phantom images demonstrating the differences in lesion visibility among ARFI (A,F), SWEI (B,G), B-mode (C,H), MF (D,I), and mpUS (E,J). Lesion 1 is indicated with the green arrows, and the TZ is indicated by the blue arrows. Note the decreased lesion visibility in the B-mode images as compared to all other modalities. Also note the poorer image quality of ARFI and SWEI at increased depth axially, which occurs due to the lower SNR and poor tracking in the hypoechoic deep regions. The ARFI colormap ranges from 0.5 (black) to 5.5 (light copper). The SWEI colormap ranges from 2.0 m/s (light yellow) to 6.7 m/s (black). The B- mode colormap ranges from 0.0 dB (light gray) to −50.0 dB (black). The MF colormap ranges from 22.5 dB/m/sr (light gray) to −8.9 dB/m/sr (black). The mpUS colormap ranges from −20.0 a.u. (light gray) to 0.0 a.u. (black).
