
Figure 6:
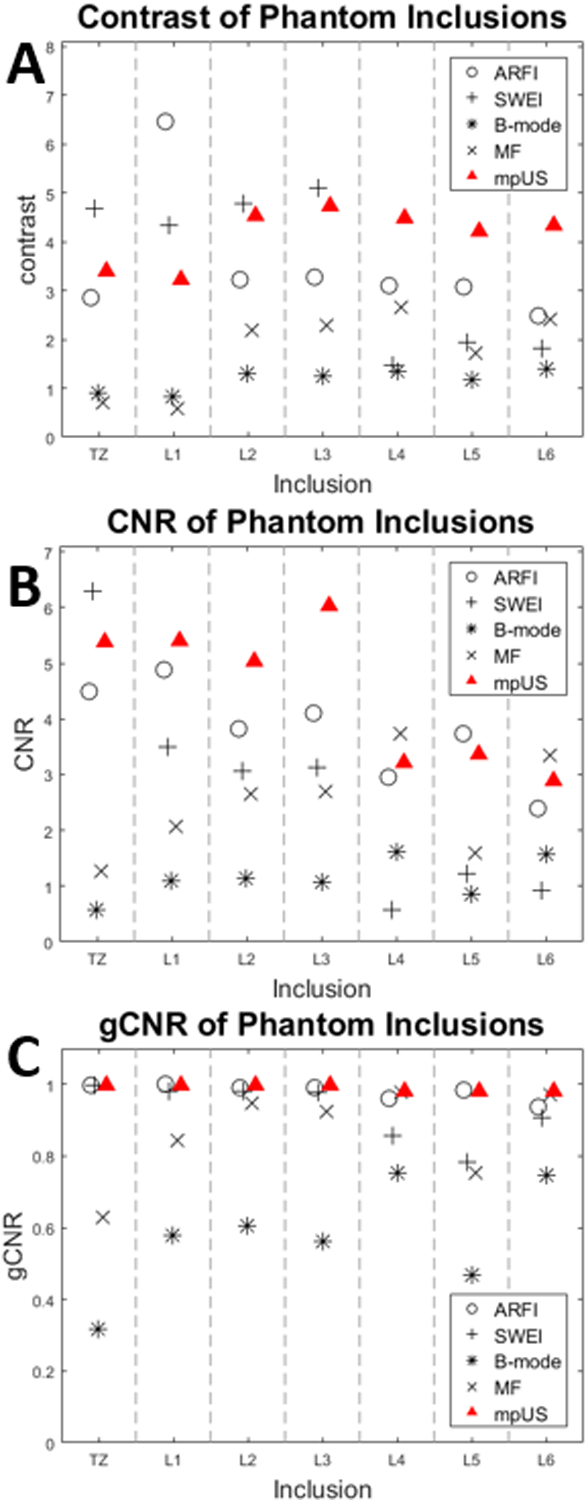
Imaging metrics and imaging modality versus phantom inclusion. mpUS (red Triangle) performs consistently well across contrast (A), CNR (B), and gCNR (C). Note that in subfigure A, the B-mode (*) and MF (x) contrast for the TZ and Lesion 1 are below 1 which leads to a decrease in mpUS for these regions.