
Figure 9:
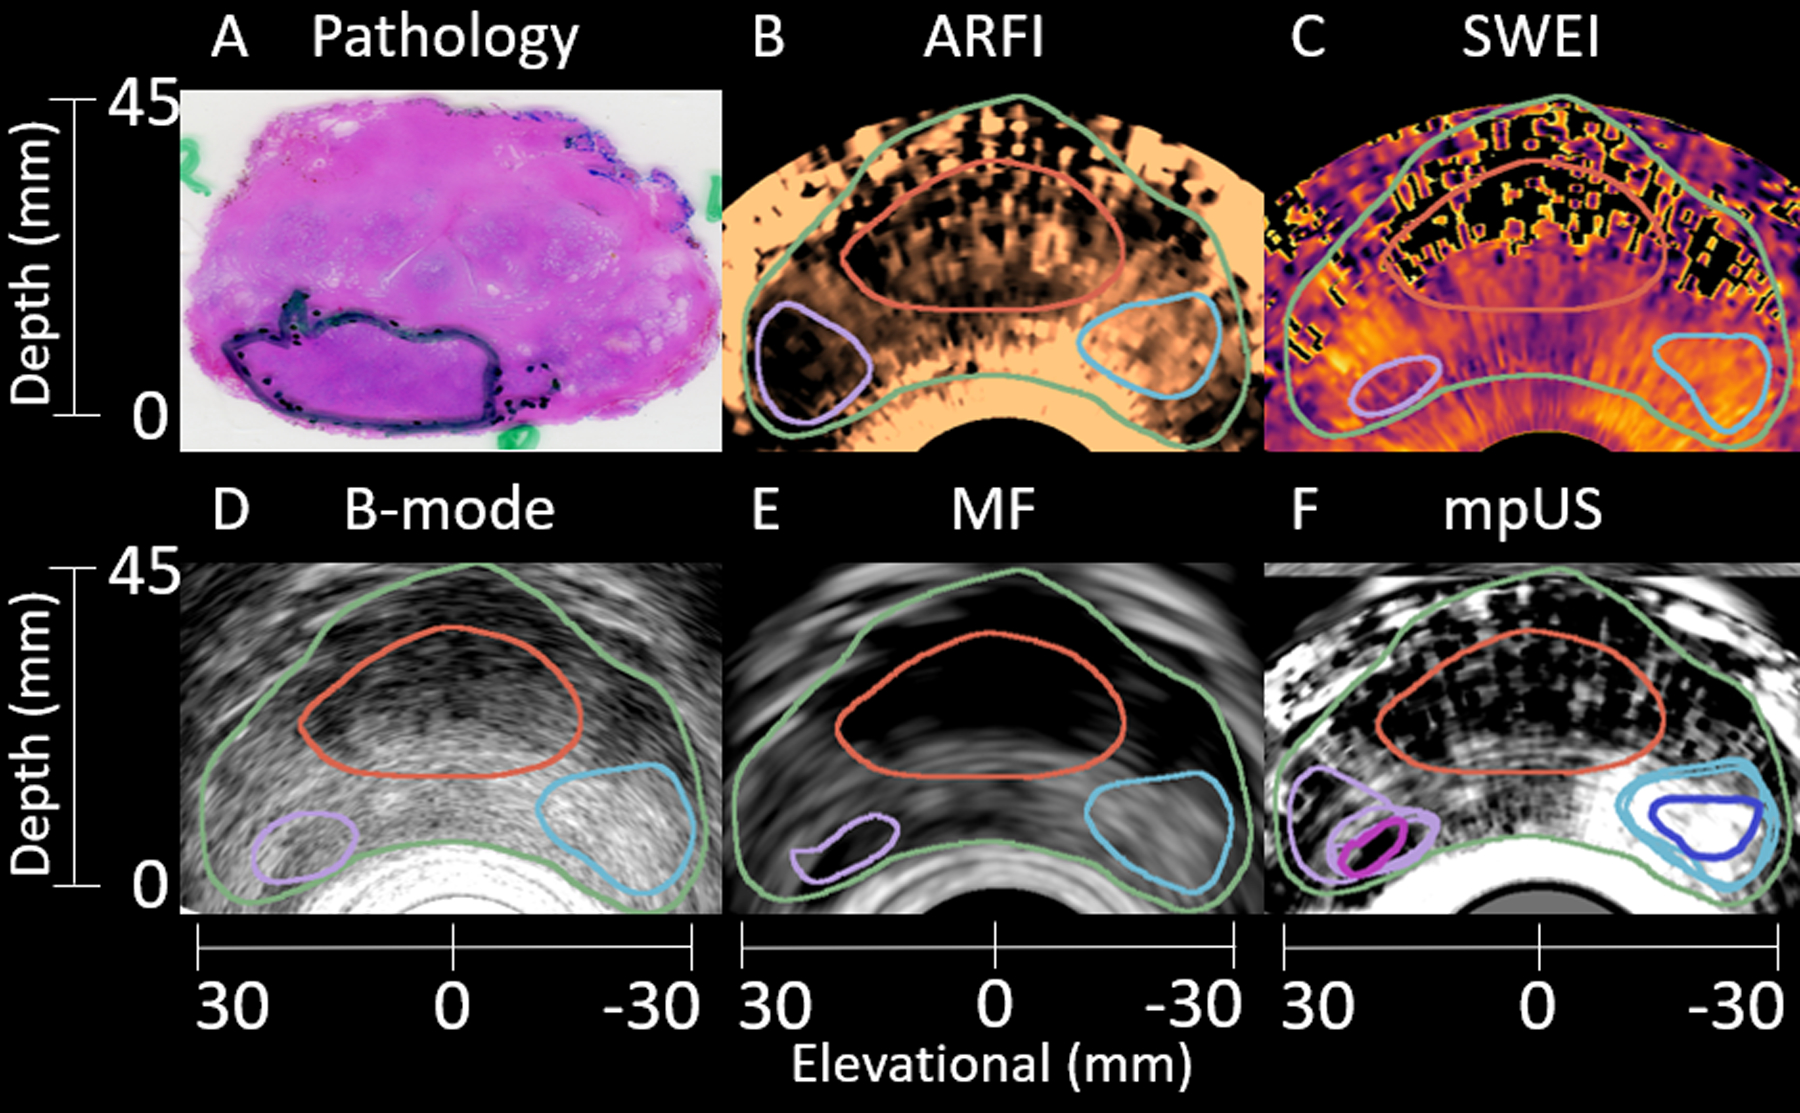
Sample matched histology slide (A) with axial patient images (B-F) demonstrating identification of a clinically significant 5.3 mL Gleason Grade Group 2 (Gleason Score 3+4=7) lesion. The lesion (A, green outline) is segmented in ARFI (B), SWEI (C), B-mode (D), and MF (E) (purple outline). Another region, corresponding to healthy tissue is identified in B-E (light blue outline). The mpUS image (F) includes all segmentations with the healthy intersection (dark blue) and PCa intersection (pink). The prostate capsule (green) and CZ (red) are identified in B-F. Note the differences in shape of the PCa based on the imaging modality, and the decreased signal quality at depth in SWEI (C). The ARFI colormap ranges from 0.3 μm (black) to 3.2 μm (light copper). The SWEI colormap ranges from 2.2 m/s (light yellow) to 9.9 m/s (black). The B-mode colormap ranges from −15.3 dB (light gray) to −61.8 dB (black). The MF colormap ranges from 30.6 dB/m/sr (light gray) to 2.6 dB/m/sr (black). The mpUS colormap ranges from −4.8 a.u. (light gray) to 1.0 a.u. (black).