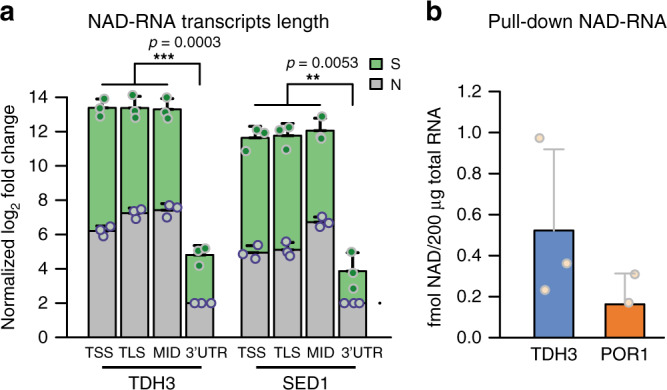
Fig. 2. Characterization of NAD-RNAs from WT yeast.

a qRT-PCR of NAD-RNAs targeting different regions of the gene: the 5′-end including the transcription start site (TSS), the region around the translation start site (TLS), a middle (MID) region around the first in-frame ATG after the TLS, and the 3′-UTR. Green bar heights represent relative transcript numbers in the sample group (+ADPRC), whereas gray bar heights represent the transcripts numbers from the same species in the negative control group (−ADPRC). Log2 fold change of TLS, TSS, and MID was normalized to the 3′-UTR of N (set as 2). Dots represent the measured values. Error bars represent mean + SD. Performed in biologically independent replicates, n = 3. p-values are denoted by asterisks: *p < 0.05; **p < 0.01; ***p < 0.001 (the minimum value among TSS, TLS, MID vs. the value from the 3′-UTR, Student’s t-test, one-sided). b Pulled-down NAD-RNA quantified by LC-MS. NAD-RNAs were estimated by measuring the NAD content, which was determined based on the signal intensity of nicotinamide riboside (NR) (fmol) from NudC-treated pulldown RNA subtracted by NR signal intensities, obtained from RNA not treated with NudC. Performed in biologically independent replicates, n = 3. Statistics parameters are as in Fig. 2a. Source data are provided as a Source Data file.
