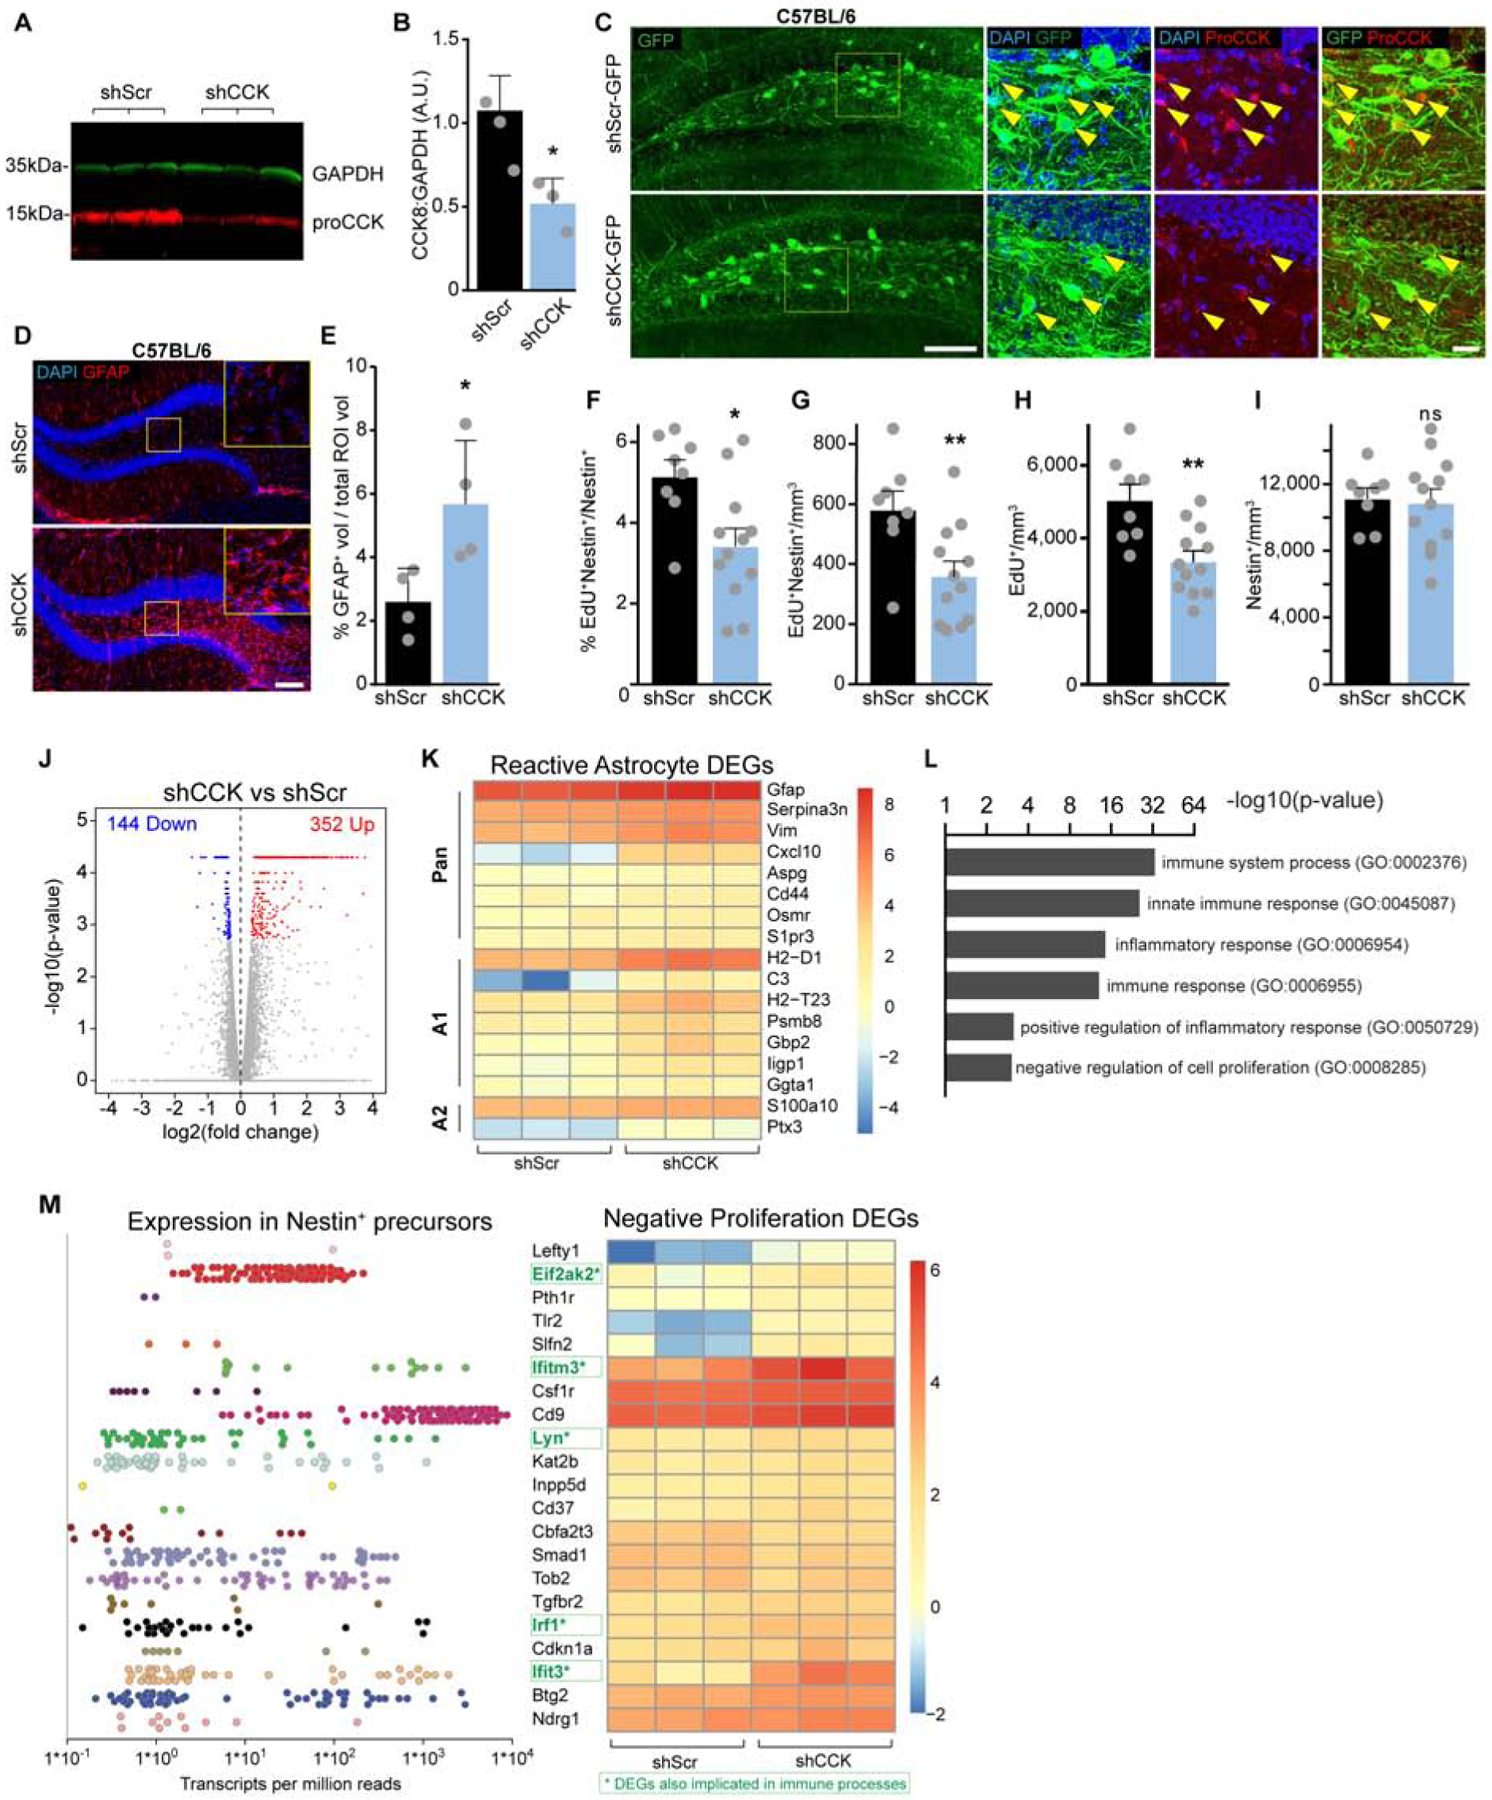
Figure 7. Reduced dentate CCK induces reactive astrocytes and decreases rNSCs proliferation potentially via neuroinflammatory-related gene profiles.

(A-B) Western blot and densitometry of hippocampal lysates 1 month after injection of shCCK or shScr AAVs. p=0.02 from (3,3) animals by Student’s t-test.
(C) Reduced CCK immunofluorescence in the hilus of shCCK treated animals. Arrows indicate targeted GFP+ hilar cells. Scale bars 100 μm, 20 μm.
(D) GFAP reactivity after knockdown of DG CCK. Scale bar 100 μm.
(E) Quantification of %GFAP immunofluorescence per volume for (4,4) animals. p=0.03 by unpaired t-test.
(F-I) Proportion (F) and density (G) of proliferating rNSCs, density (H) of total proliferating cells, and total (I) rNSC pool after shCCK. Bars indicate means ± SD. p=(0.011,0.009,0.002,0.81) for (8,12) animals by Student’s t-test.
(J) Volcano plot of fold changes in gene expression due to shCCK, highlighting upregulated and downregulated DEGs.
(K) Heatmap of 17 DEGs related to reactive astrocyte states from 3 animals in each treatment group. Pan-reactive, type A1, and type A2 reactive astrocyte genes are indicated. Color indicates direction and relative magnitude of FPKMs.
(L) Gene Ontology terms identified from analysis of all 496 DEGs identifying immune processes and negative regulation of proliferation.
(M) Transcript expression in rNSCs (based on Shin et al 2015) and heatmap of 21 DEGs related to negative control of proliferation. Color indicates direction and relative magnitude of FPKMs. Green highlighted genes are additionally implicated in immune processes. See also Figure S6.
