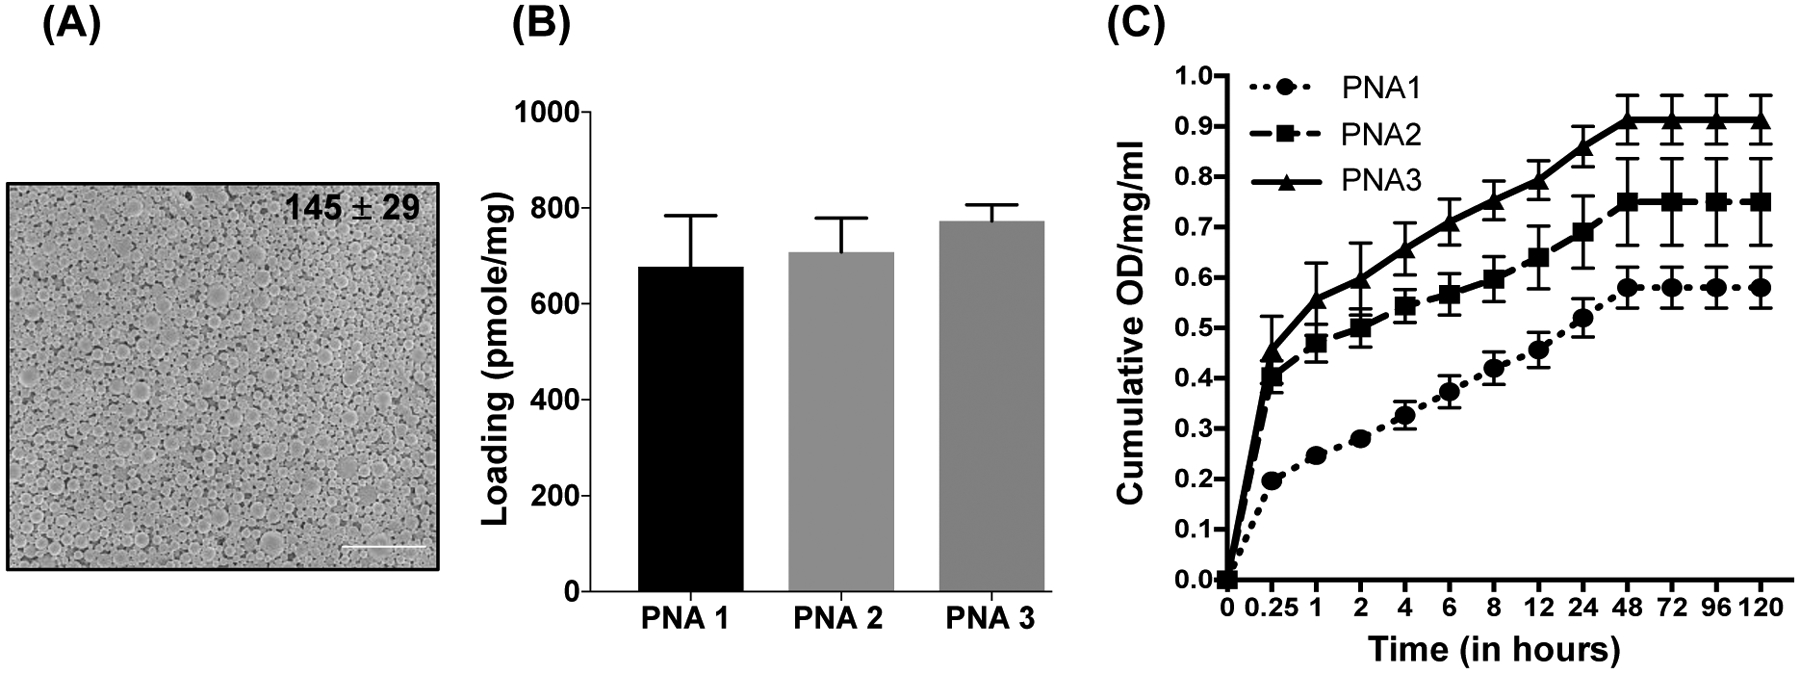
Figure 3.

(A) Representative SEM image of PLGA NPs containing PNA3. The image was captured at 10,000X magnification. The scale bar is 4 μm. The average particle diameter (nm) and standard deviation are given for NPs. (B) PNAs loading analysis results. (C) Cumulative release profile data of PNA1, PNA2 and PNA3 from PLGA NPs at a given time point (shown on the X axis). N=3, data are shown as mean ± standard error mean (SEM).
