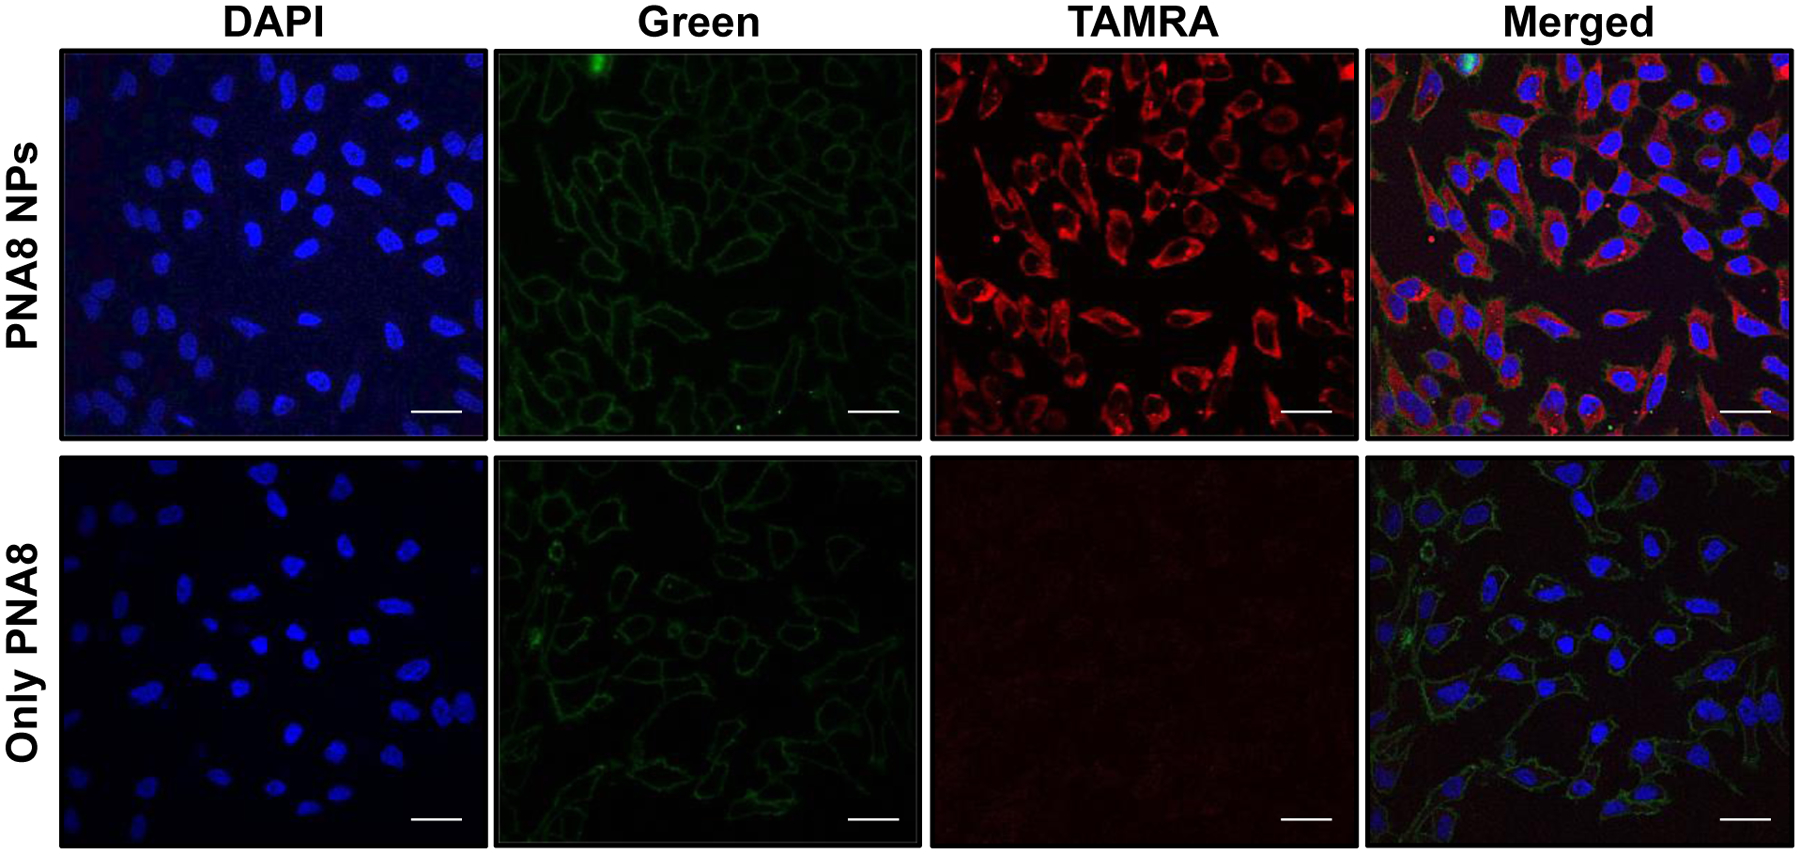
Figure 5.

Cellular uptake studies. Confocal images of HeLa cells after 24 hours of incubation with PLGA NPs containing PNA8. Further, DAPI was used for staining the nucleus and cell membrane was stained using MemBrite™ dye. A representative image from at least three fields is shown. Please note the concentration of only PNA8 is the same as that encapsulated in PLGA NPs (1.4 nmole of PNA equivalent dose) for comparative analysis. Blue: DAPI (nucleus), Green: cell membrane, Red: TAMRA PNA. The images were equally enhanced for clarity using ImageJ. The scale bar is 30 μm.
