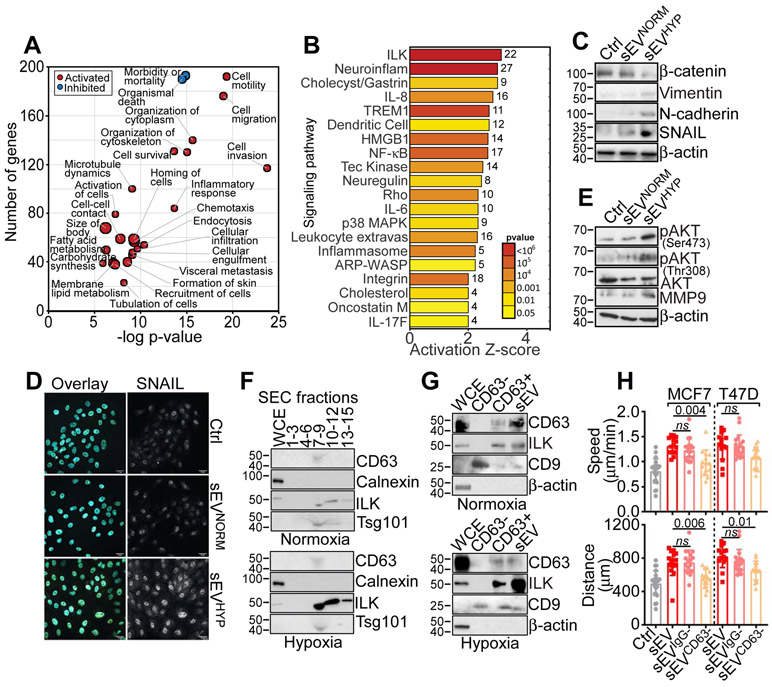
Figure 3. sEVHYP-induced reprogramming of normal mammary epithelial cells.
(A) Ingenuity Pathway Analysis of genes significantly modulated (red, activated; blue, inhibited) in MCF10A cells treated with sEVHYP by RNA-Seq (p<0.05).
(B) Bioinformatics analysis of gene pathways regulated by sEVHYP in recipient MCF10A cells by RNA-Seq. The activation Z-score and p values are indicated.
(C) sEVNORM or sEVHYP-treated MCF10A cells were analyzed by Western blotting (N=3).
(D) The conditions are as in (C) and MCF10A cells were analyzed for nuclear accumulation of SNAIL by fluorescence microscopy (representative images, N=3). Scale bar, 25 μm.
(E) sEVNORM or sEVHYP-treated MCF10A cells were analyzed by Western blotting (N=3).
(F) Whole cell extracts (WCE) or the indicated sEV-containing SEC fractions isolated from normoxic (top) or hypoxic (bottom) MCF7 cells were analyzed by Western blotting (N=2).
(G) WCE, unfractionated sEV or CD63-positive (CD63+) or -negative (CD63−) sEV isolated from normoxic (top) or hypoxic (bottom) MCF7 cells were analyzed by Western blotting. An antibody to CD9 was used as a control (N=3).
(H) MCF10A cells treated with total sEV, IgG-negative sEV (sEVIgG−) or CD63-negative sEV (sEVCD63−) isolated from MCF7 or T47D cells were analyzed for 2D motility with quantification of speed of cell movements (top) and total distance traveled by individual cells (bottom). Non-binding-sEV to IgG-coated beads were used as control. Mean±SD (N=3). Numbers correspond to p values by 1-way Anova with Tukey’s posttest.

