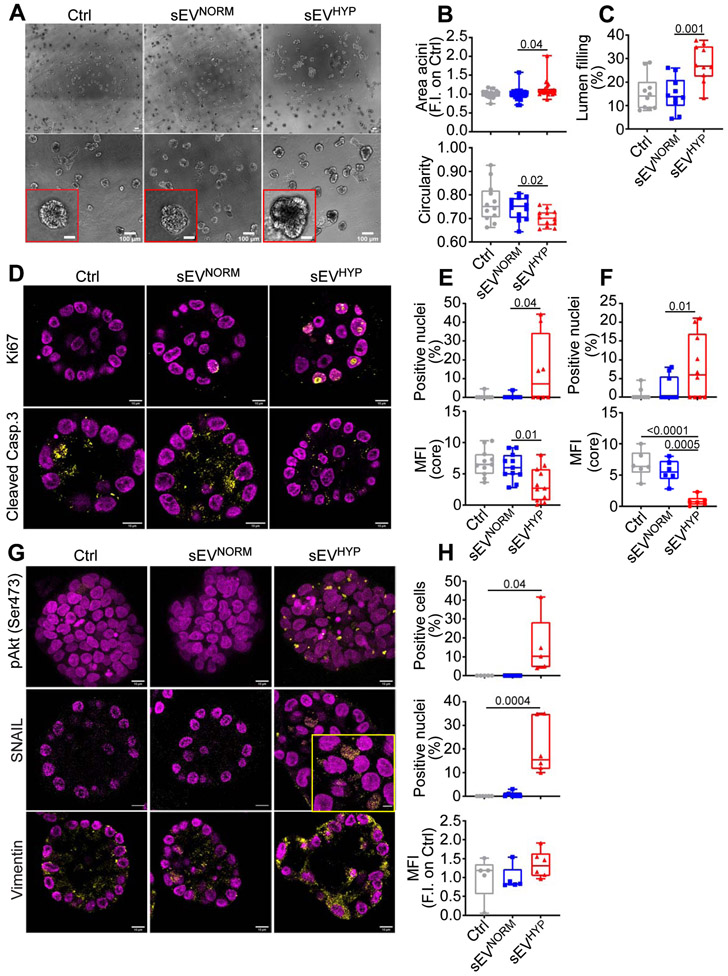
Figure 6. sEVHYP regulation of 3D mammary acini development.
(A) MCF10A cells were seeded in 3D acini culture in the presence of Ctrl, sEVNORM or sEVHYP for 21 d and imaged by brightfield microscopy. Insets, image magnification of indicated areas. Scale bar, 100 μm. (N=3).
(B) The conditions are as in (A) and the surface area (top) and circularity (bottom, 1=perfect circle) of sEV-treated MCF10A acini in 3D culture were quantified. Each dot represents the mean of MCF10A acini in one 10x microscopy field. An average of 12 independent microscopy fields were used for counting. Data are expressed as boxplots (min to max) of at least three independent experiments. Numbers correspond to p values by 1-way Anova with Tukey’s multiple comparisons test.
(C) The conditions are as in (A) and the lumen filling of sEV-treated MCF10A acini in 3D was quantified. Data are expressed as boxplots (min to max) of at least three independent experiments. Numbers correspond to p values by 1-way Anova with Tukey’s multiple comparisons test.
(D) sEV-treated MCF10A acini in 3D as in (A) were analyzed for Ki67 (top) or cleaved caspase 3 (bottom) reactivity after 8 d, by immunohistochemistry. Representative equatorial section images. Scale bar, 10 μm.
(E and F) The conditions are as in (D) and the percentage of Ki67+ nuclei and cleaved caspase 3-expressing cells was quantified for sEV added once at t=0 (E) or sequentially every 4 d (F). MFI, mean fluorescence intensity. Data are expressed as boxplots (min to max) of at least three independent experiments. Numbers correspond to p values by 1-way Anova with Tukey’s multiple comparisons test.
(G) The conditions are as in (D) and sEV-treated MCF10A acini in 3D were analyzed for expression of pAkt (Ser473, top), nuclear accumulation of SNAIL (middle) or levels of vimentin (bottom) after 21 d, by immunohistochemistry. Representative confocal microscopy images are shown; inset, magnification of selected field. Scale bar, 10 μm.
(H) The conditions are as in (G) and the percentage of pAkt+ cells (max projection), SNAIL+ nuclei and expression of vimentin was quantified. Data are expressed as boxplots (min to max) of at least three independent experiments (8 independent acini per condition). MFI, mean fluorescence intensity. Numbers correspond to p values by 1-way Anova with Tukey’s multiple comparisons test, N=3. See also Figures S7.

