Fig. 4.
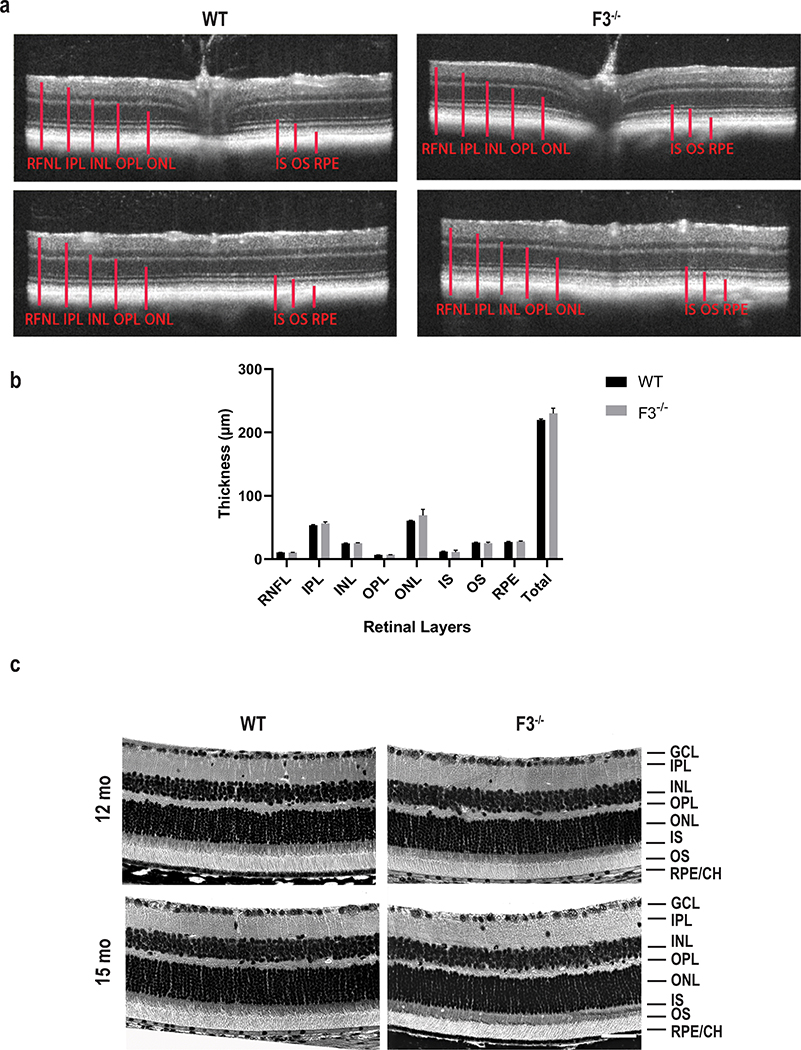
Retina remains structurally intact in the absence of F3. (a) Representative images of SD-OCT examination. SD-OCT scans of F3−/− and WT mice show no distinguishable changes in thickness for all the retinal layers at 9 months. Top panel represents scans from optic nerve head and bottom panels from the periphery. (b) Graph representing comparison of thickness of retinal layers between WT and F3−/− represented as mean ± SD. (c) Retinal histology. Representative images showing comparable histological structures in F3−/− and WT animals at 15 months (scale bar = 50 μm). RNFL retinal nerve fiber layer, GCL ganglion cell layer, IPL inner plexiform layer, INL inner nuclear layer, OPL outer plexiform layer, ONL outer nuclear layer, IS inner segment, OS outer segment, RPE retinal pigment epithelium, CH choroid (n = 6–7)

