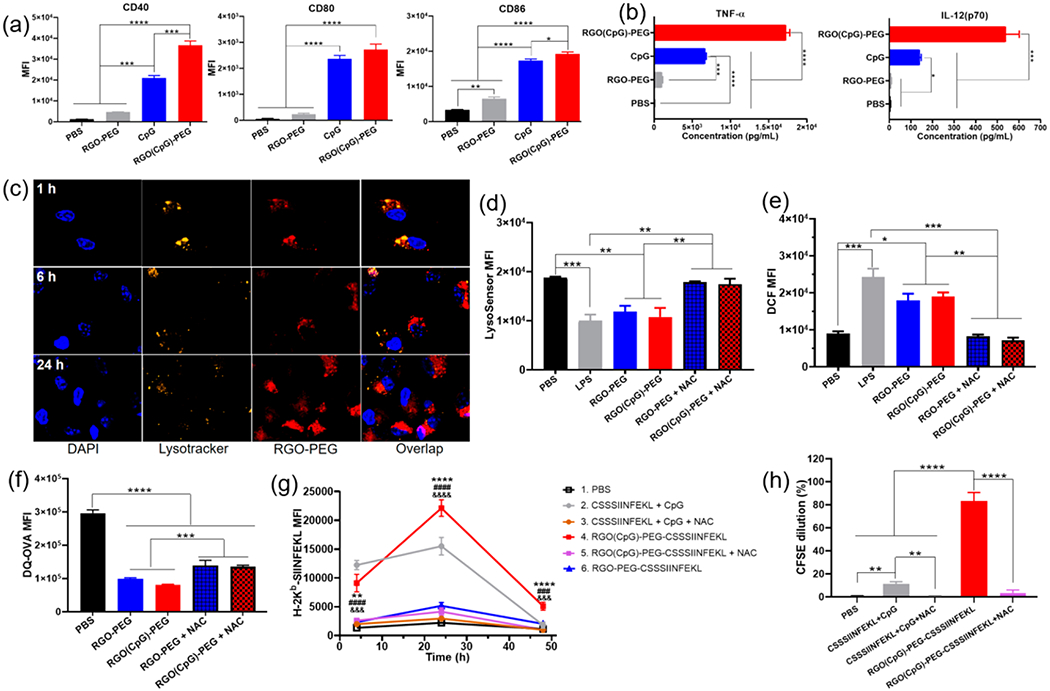
Figure 2.

RGO-PEG promotes intracellular ROS, antigen presentation on DCs, and induction of CD8α+ T cells. (a) CD40, CD80, and CD86 expression levels on BMDCs and (b) TNF-α and IL-12(p70) secretion by BMDCs incubated with PBS, RGO-PEG, soluble CpG, or RGO(CpG)-PEG for 8 h. (c) Confocal microscopy images of BMDCs incubated with RGO-PEG-Cy5 (red). BMDCs were stained with Lysotracker dye. (d) LysoSensor fluorescence intensity and (e) intracellular DCF; (f) DQ-OVA fluorescence intensity in BMDCs incubated with the indicated formulations with or without ROS inhibitor NAC (5 mM) for 24 h (d, f) or 4 h (e). (g) SIINFEKL-H-2Kb presentation was quantified on BMDCs after incubation with the indicated formulations for 24 h. *, #, and & indicate statistical differences between group 4 and group 2 (*), 5 (&), or 6 (#). (h) CFSE dilution of OT-I CD8α+ T cells after 48 h of coculture with BMDCs pretreated as in (g). Data represent mean ± SEM from a representative experiment (n = 3) from three independent experiments (a–e) or two independent experiments (f–h). Data were analyzed by one-way ANOVA (a, b, d–f, h) or two-way ANOVA (g) with Tukey’s HSD multiple comparison post hoc test. *P < 0.05, **P < 0.01, ***P < 0.001, ****P < 0.0001.
