
Figure 1. Approach for projecting transcriptomic class onto anatomical tissue sections.
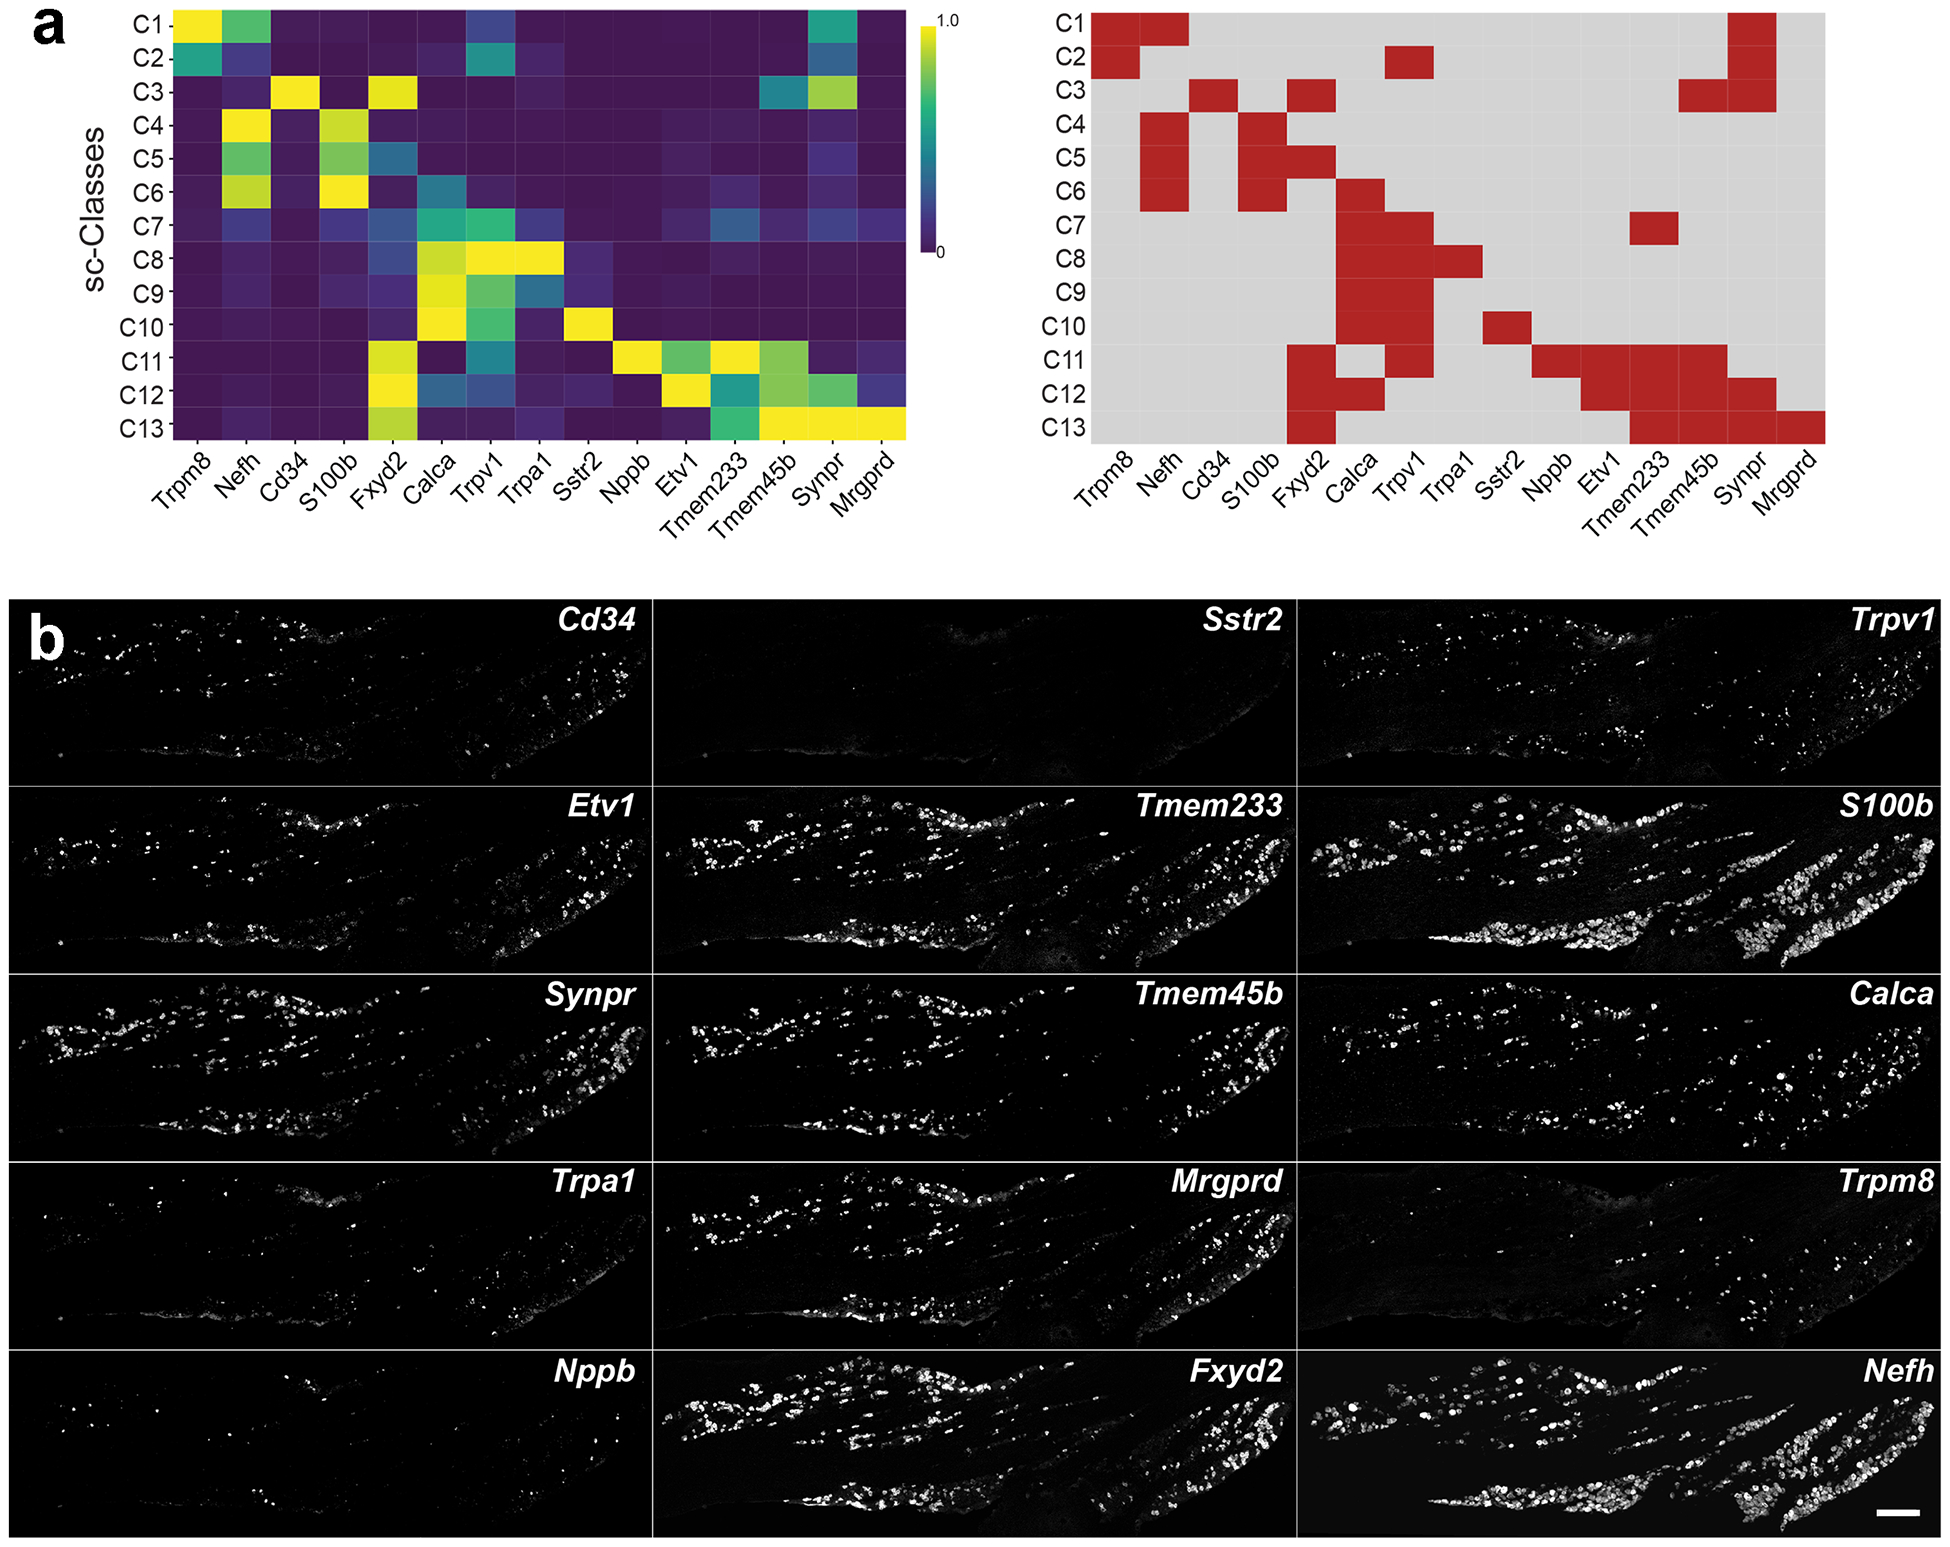
(a) Left, average expression levels of diagnostic markers in scRNA sequence analysis [32]; genes are: Transient receptor potential cation channel subfamily M (melastatin) member 8 (Trpm8), Neurofilament heavy (Nefh), the transmembrane phosphoglycoprotein Cd34, S100 calcium-binding protein B (S100b), FXYD Domain Containing Ion Transport Regulator 2 (Fxyd2), Calcitonin related polypeptide alpha (Calca), Transient receptor potential cation channel subfamily V member 1 (Trpv1), Transient receptor potential cation channel, subfamily A, member 1 (Trpa1), Somatostatin receptor 2 (Sstr2), Natriuretic polypeptide B (Nppb), ETS translocation variant 1 (Etv1), Transmembrane protein 233 (Tmem233), Transmembrane protein 45B (Tmem45b), Synaptoporin (Synpr) and Mas-related G-protein coupled receptor member D (Mrgprd). Right, a simplified binary analysis of their expression (red, positive; grey, negative) highlights their potential to combinatorially define trigeminal neural classes. (b) Images from three rounds of multiplexed ISH for a single section of a trigeminal ganglion from an FVB/N mouse are shown; the 5 probes used in each round of hybridization are displayed vertically. Note that for 14 probes clear positive and negative cells were identified; scale bar: 250 μm.