
Figure 2. Multiplexed ISH based classification of trigeminal neurons.
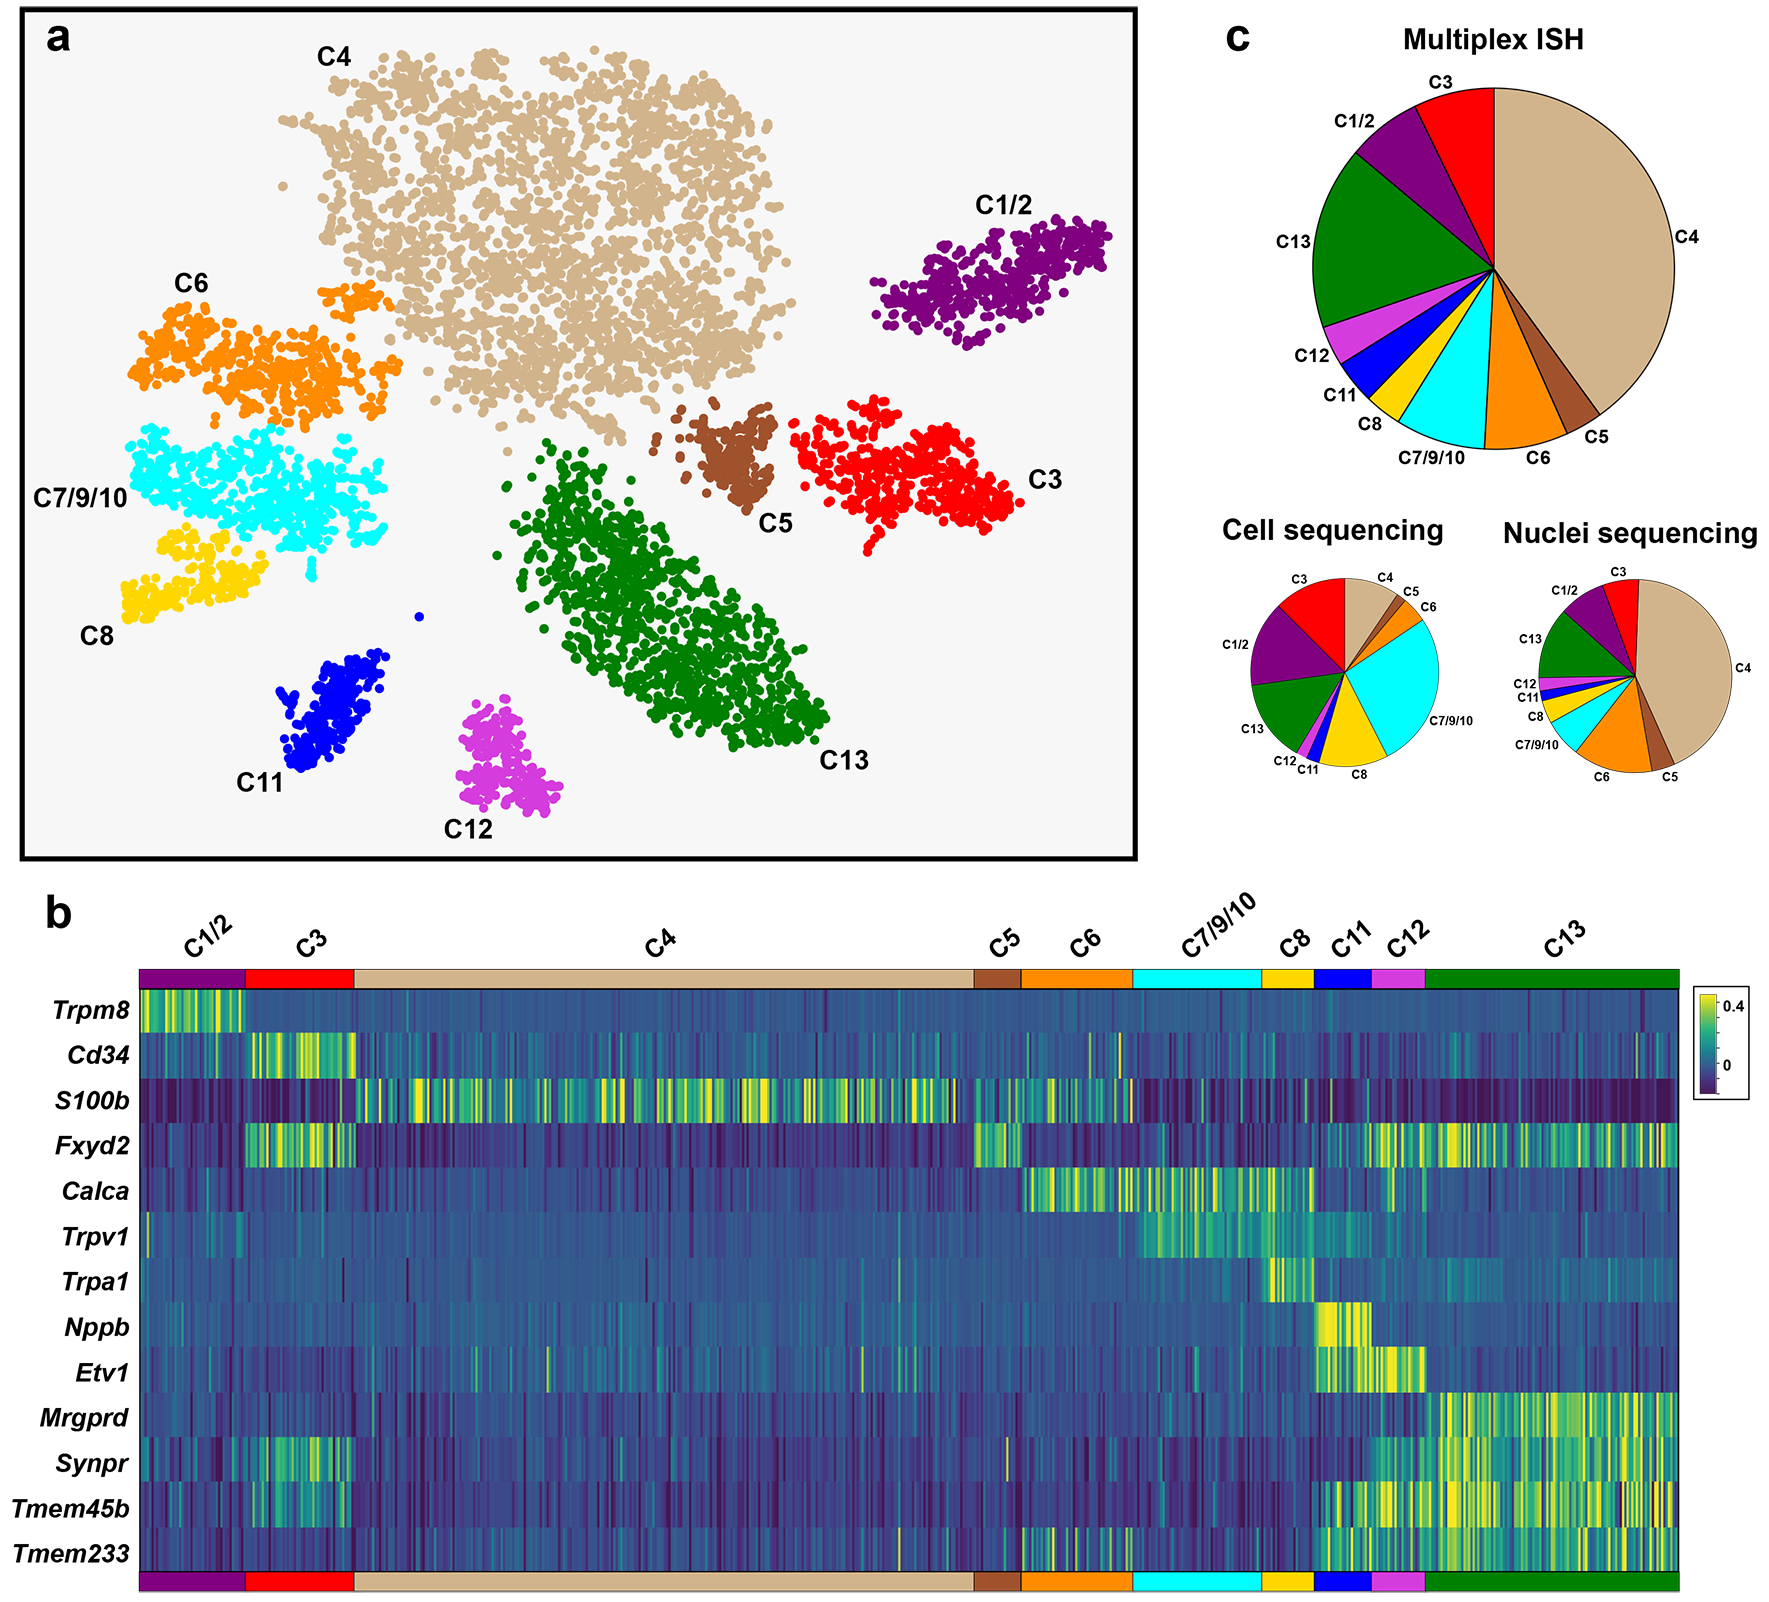
Sections through trigeminal ganglia from four mice were subjected to multiplex ISH. Neurons from a single section for each mouse were manually segmented to measure ISH signal intensity at a cellular level. (a) tSNE-representation and cluster analysis of ISH data for 13 probes showing that this approach segregated neurons into 10 groups. The correspondence of these groups with scRNA sequence defined transcriptomic classes (C1-C13) is indicated. (b) ISH signal intensity at a cellular level in the 7735 neurons; cells were ordered according to their cluster assignment with each vertical bar representing a different cell. (c) Pie charts comparing the proportions of trigeminal neurons assigned by class for multiplex ISH data, sc- and snRNA sequencing; note that cell sequencing under-represents large diameter neuronal classes C4-C6 relative to other cells.