
Figure 3. Classification of neurons from ISH images using machine learning.
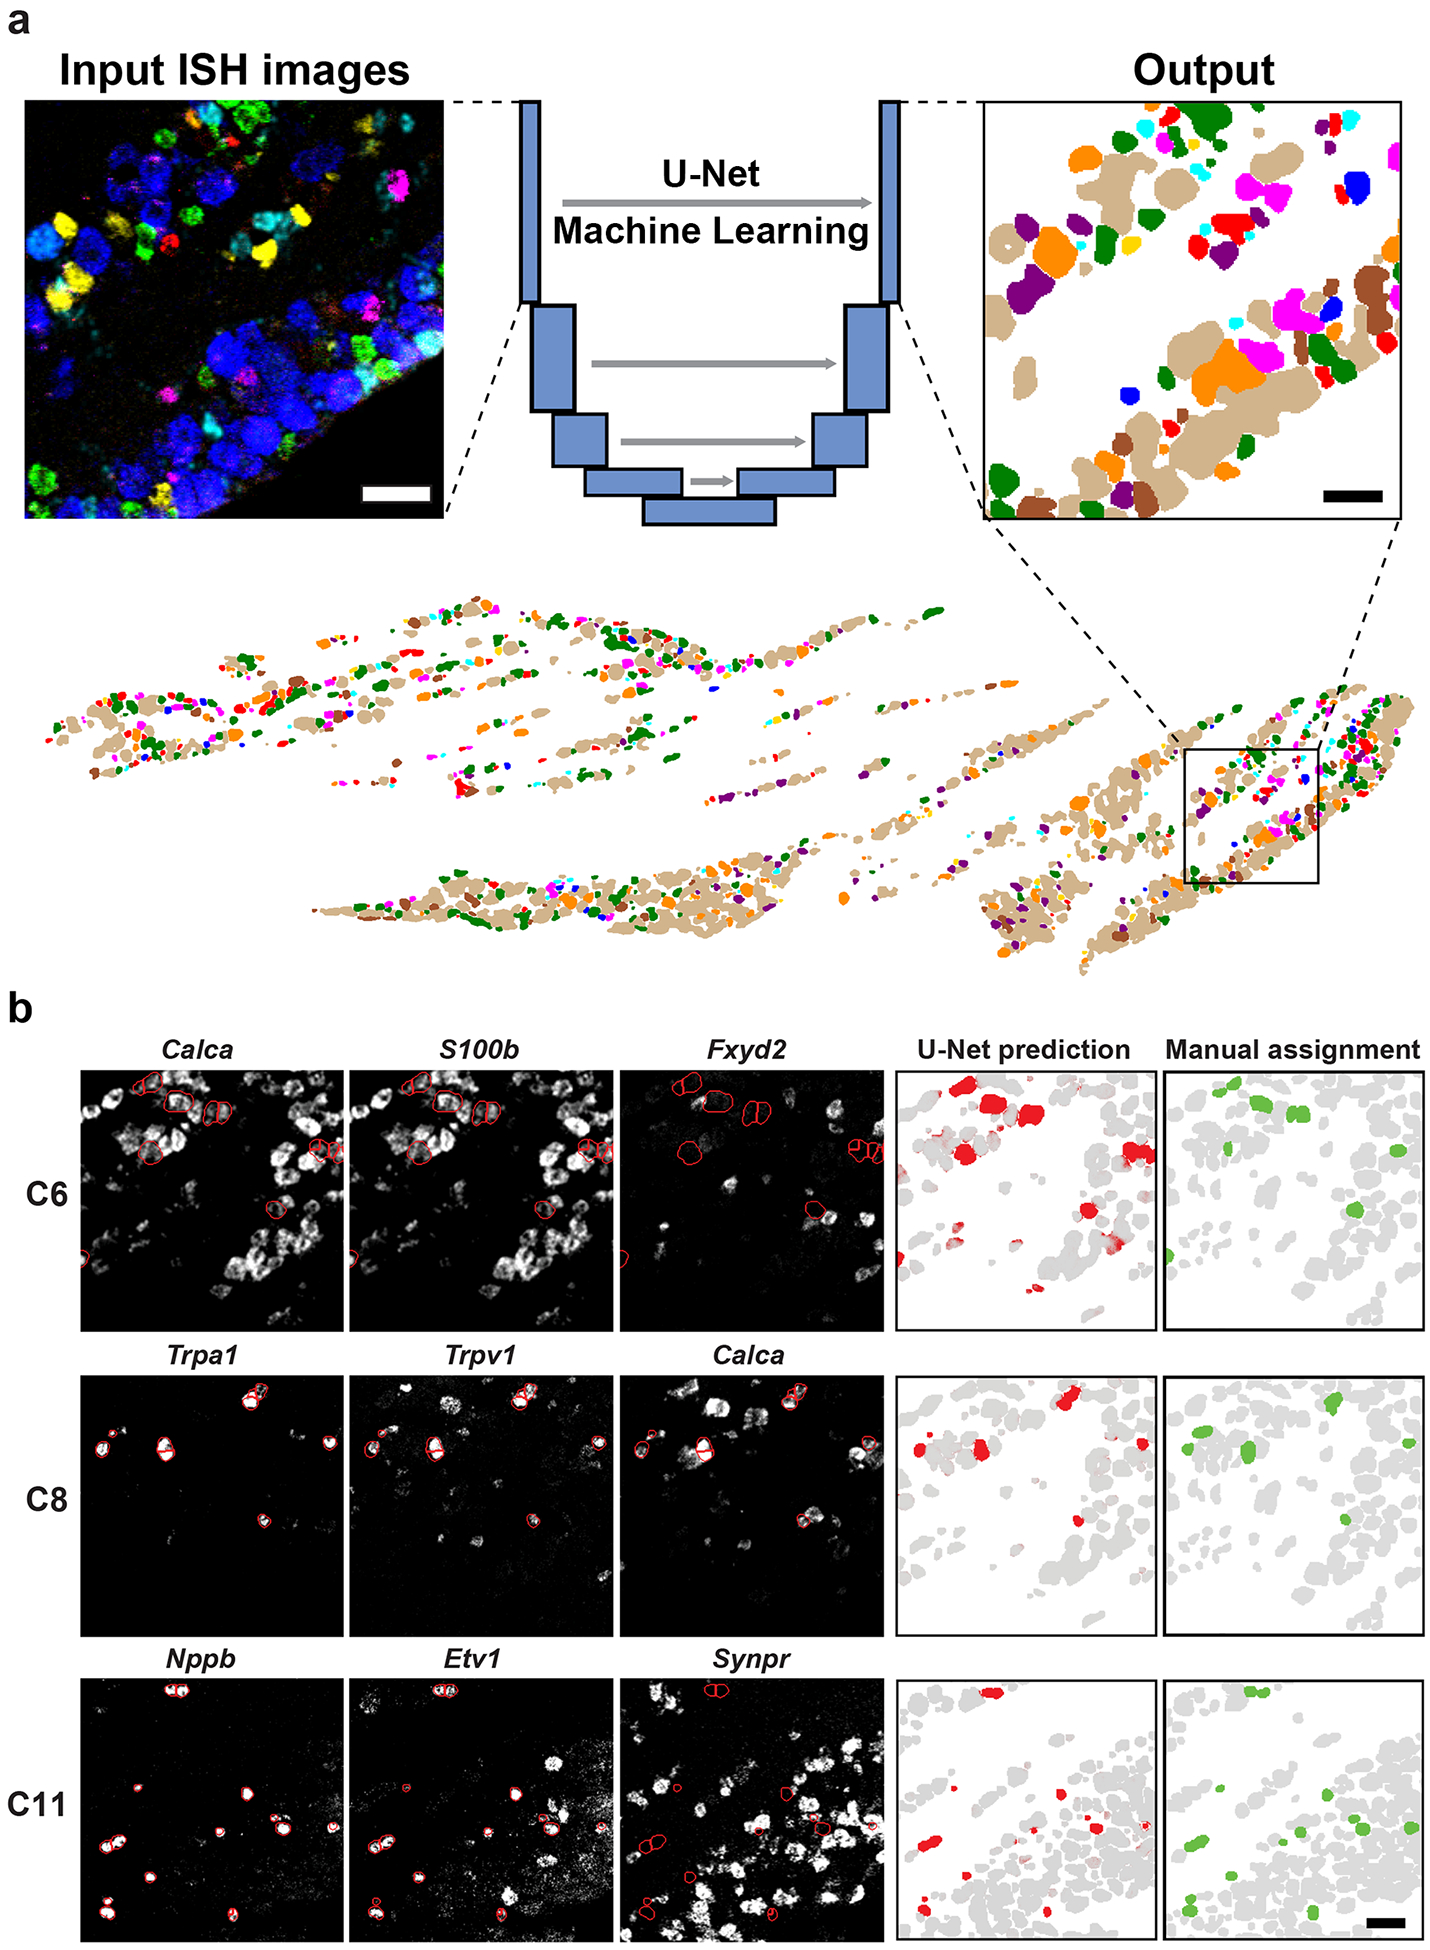
A U-Net Deep Learning algorithm was developed and trained to classify neurons directly from multiplexed ISH images. (a) Example of ISH image input to the U-Net (left panel, 6 non-overlapping probes shown) and the corresponding output (right panel, colored as in Fig. 3). The full ganglion prediction (lower panel) corresponds with the ISH images shown in Fig. 2. (b) Example predictions for 3 classes of trigeminal neurons. Key input ISH images (left three panels) overlaid with outlines of predicted cells (red) highlighting the expected patterns of gene expression: C6 cells express S100b and Calca but not Fxyd2; C8 cells express Trpa1, Trpv1 and Calca; C11 cells express Nppb and Etv1 but not Synpr. The right two panels compare the U-Net prediction probability (red) and the manually segmented and tSNE assigned class (green). Grey represents prediction of other neural classes; scale bars 50 μm.