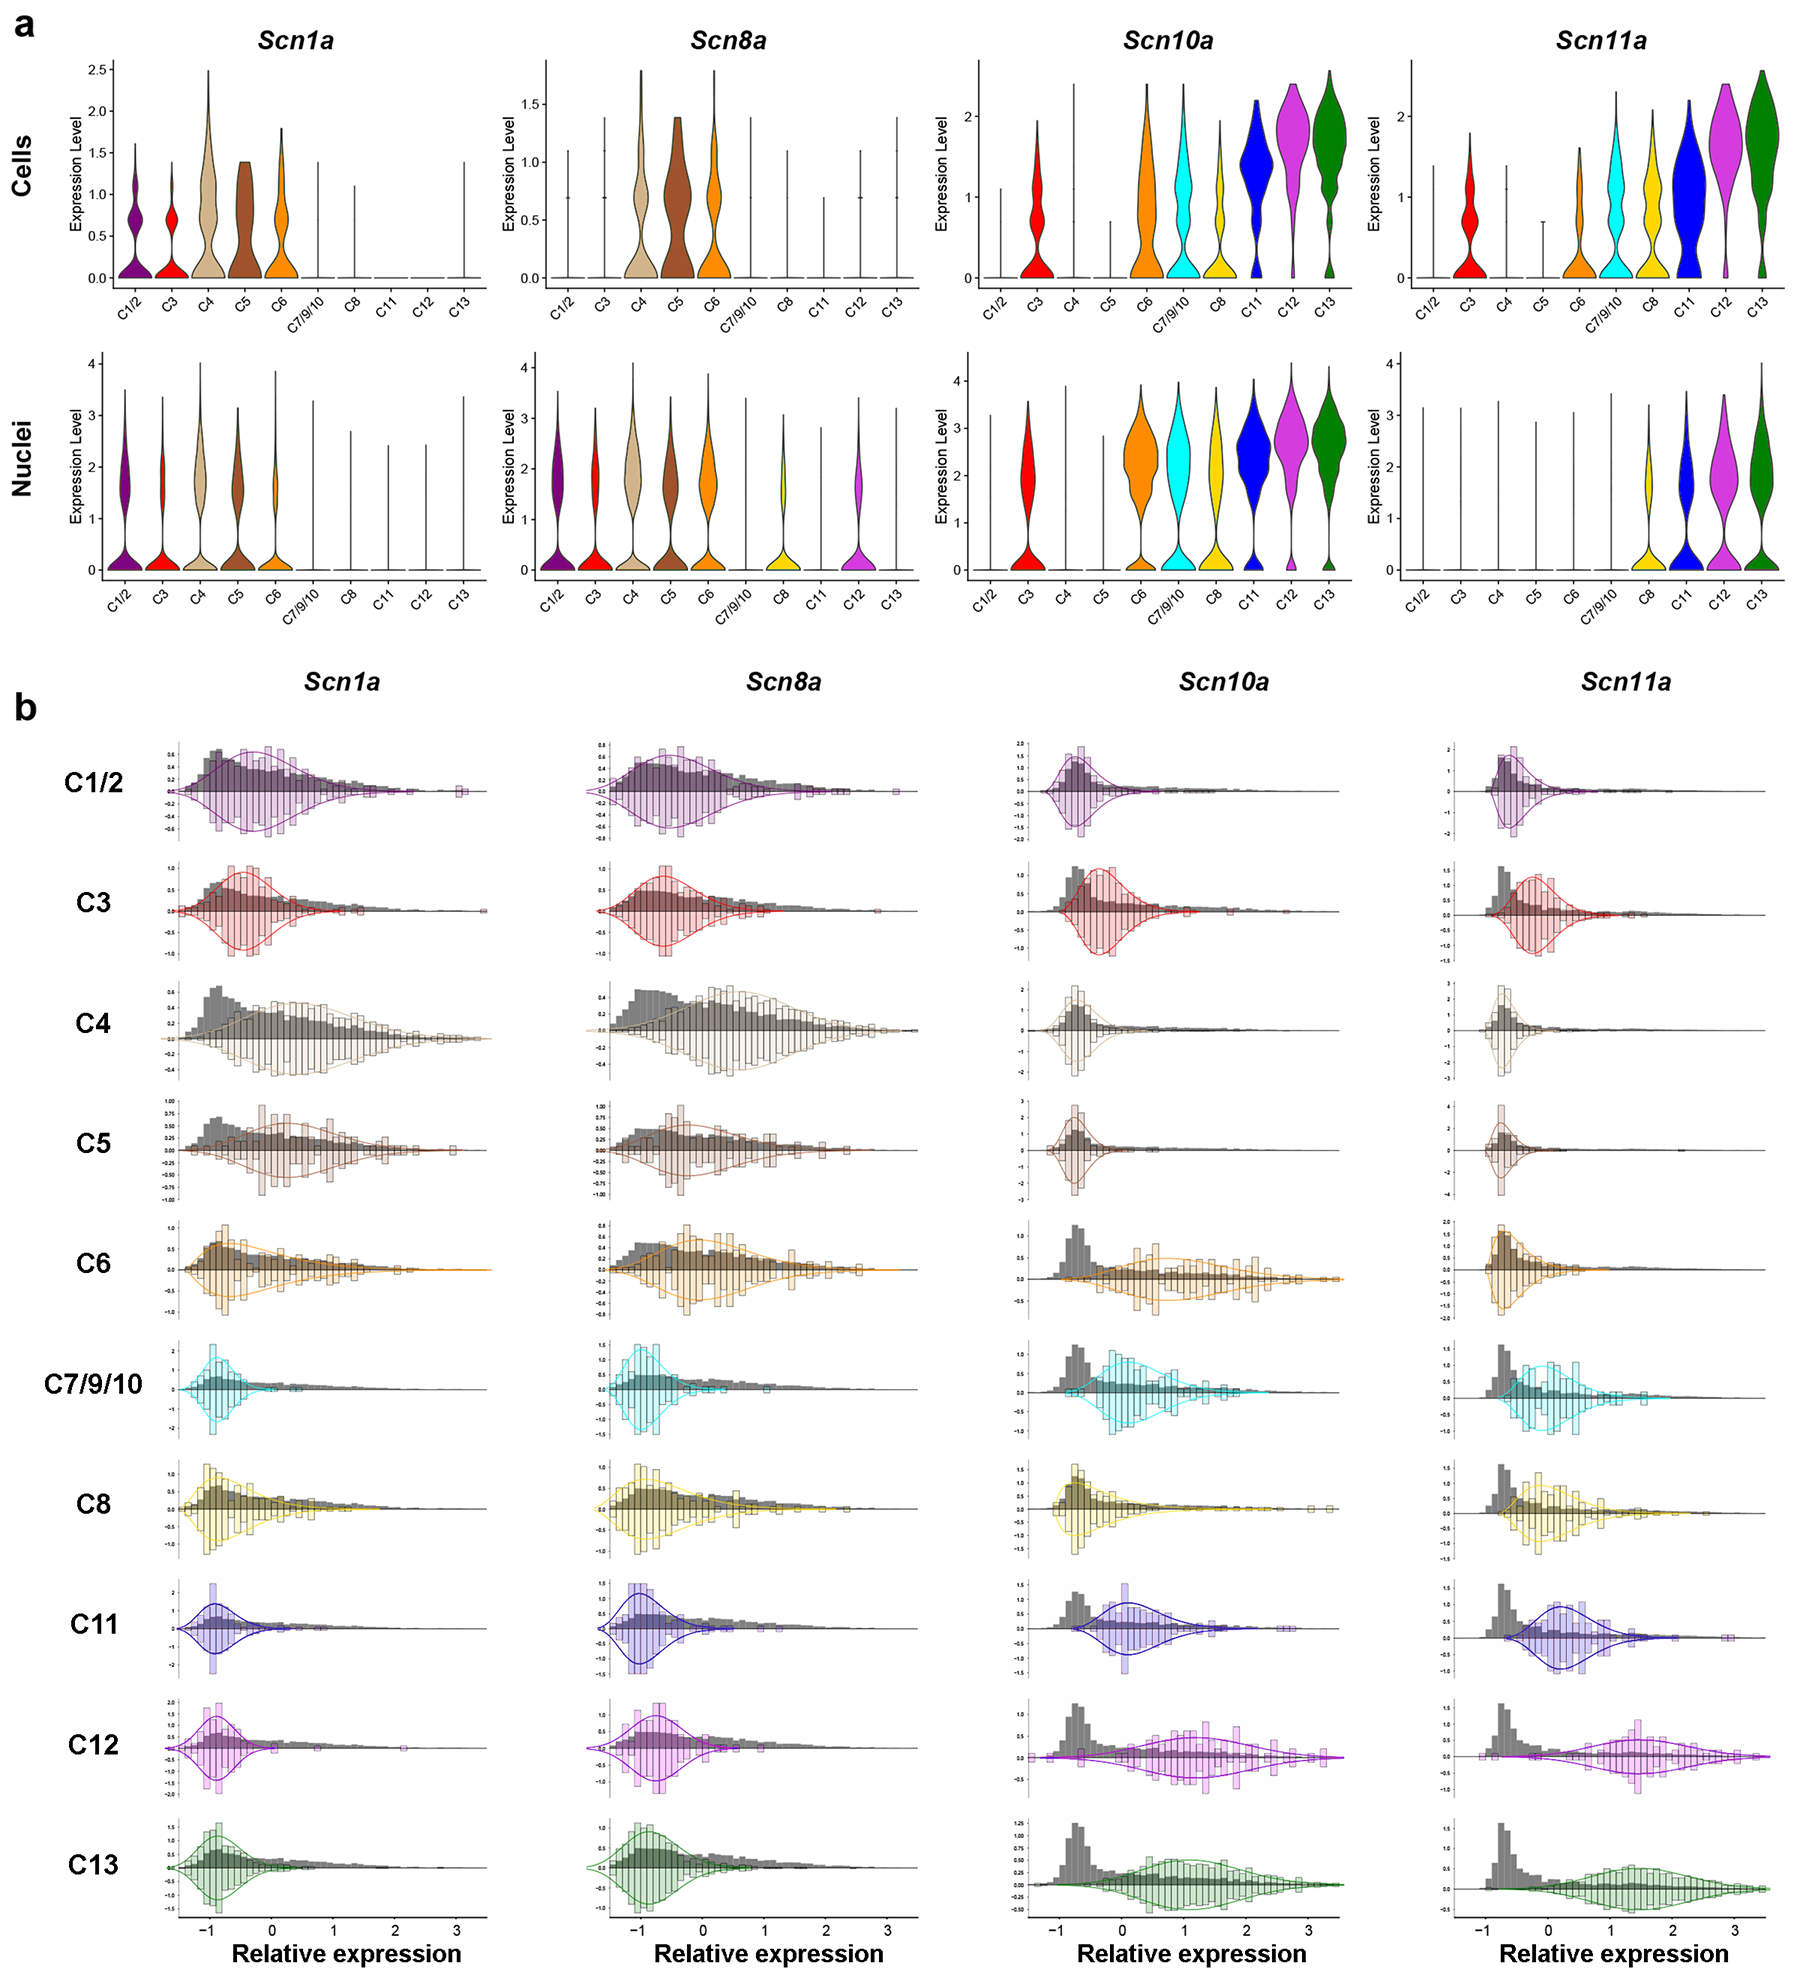
Figure 4. Analysis of voltage gated sodium channel expression in classified neurons.

(a) Violin plots of the expression of four voltage gated ion channels across trigeminal neuronal classes in the (upper panels) cell based- [32] and (lower panels) nuclei based [31] analyses. The y axes indicate expression levels that were normalized as described previously [31;32] and the x axes approximate the relative abundance of these expression levels. (b) Histograms of expression data for these ion-channels across trigeminal neuronal classes identified using multigene ISH and the U-Net classification of neurons. Grey histograms depict the relative standardized expression levels (mean = 0, variance = 1) of the channel in all trigeminal neurons along the x-axis and relative abundance of expression levels along the y-axis; colored bars, its relative expression in cells of a particular class; colored curves are gamma distributions fitted to the expression data in a class; to help highlight the expression pattern of a channel in a defined class of cells, the class histograms and fitted curves have been reflected around the x-axis which was scaled to result in a total area under the curve of 1.
