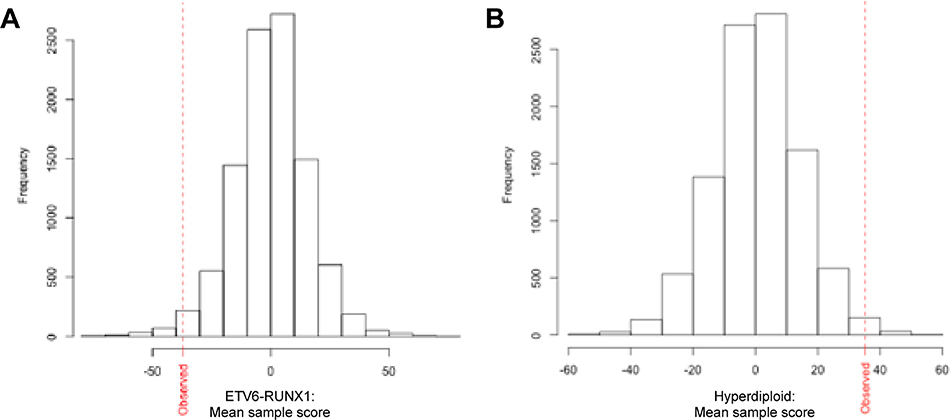
Figure 3.
Set of 30 B-1 and B-2 progenitor genes clusters ETV6-RUNX1 ALLs with B-1 genes and hyperdiploid ALLs with B-2 genes more robustly than do random gene sets. Histogram of mean sample scores of (A) ETV6-RUNX1 and (B) hyperdiploid B-ALLs in DCOG cohort calculated for 10,000 random sets of 30 genes compared to mean sample score observed with our set of 30 selected genes (red dotted line). Sample scores are ranked left to right from most B-1-like to most B-2-like. For ETV6-RUNX1 B-ALLs, the proportion of times the permuted gene sets were less than the observed value was 0.016. For hyperdiploid B-ALLs, the proportion of times the permuted gene sets were greater than the observed value was 0.0093.

