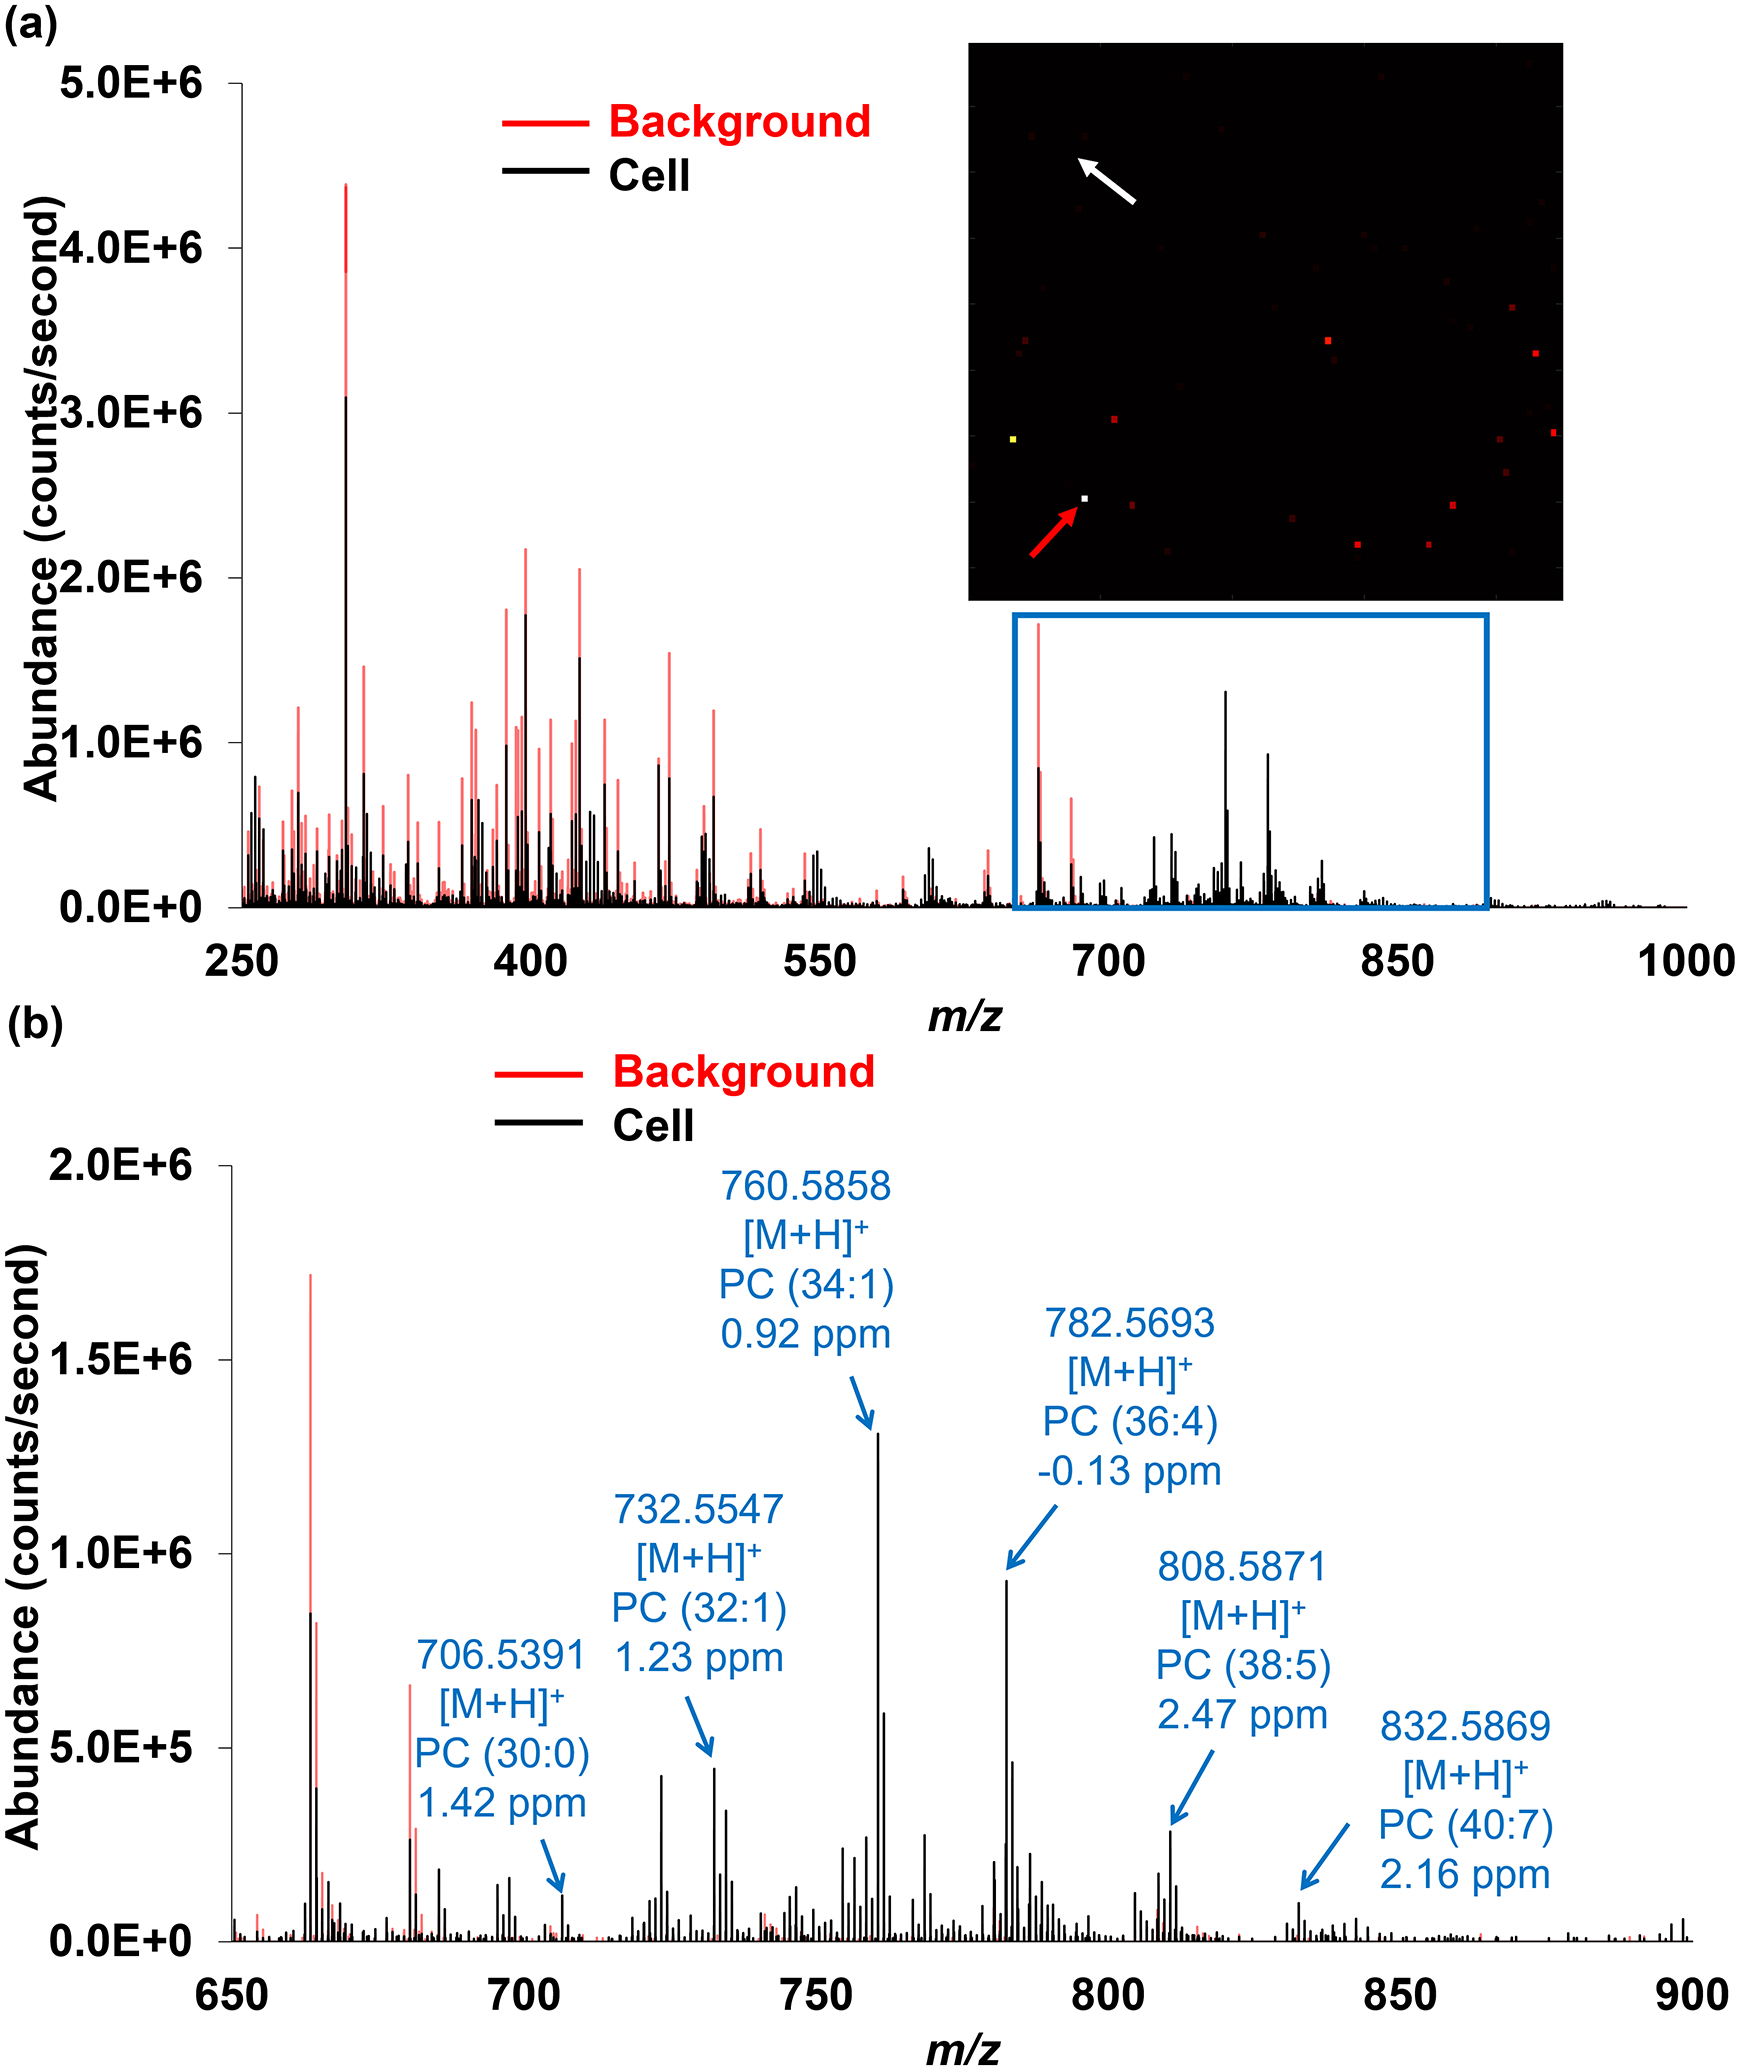
Figure 3.

(a) Positive ion mode mass spectrum (m/z 250–1000) from a single cell (pointed by the red arrow) and a background pixel (pointed by the white arrow). (b) Expanded spectrum in the range of m/z 650–900 where most cell-specific ions were detected. Representative peaks are labeled and putatively annotated based on the accurate mass measurements. See Table 1 for a complete list of the detected distinct lipid ions.
