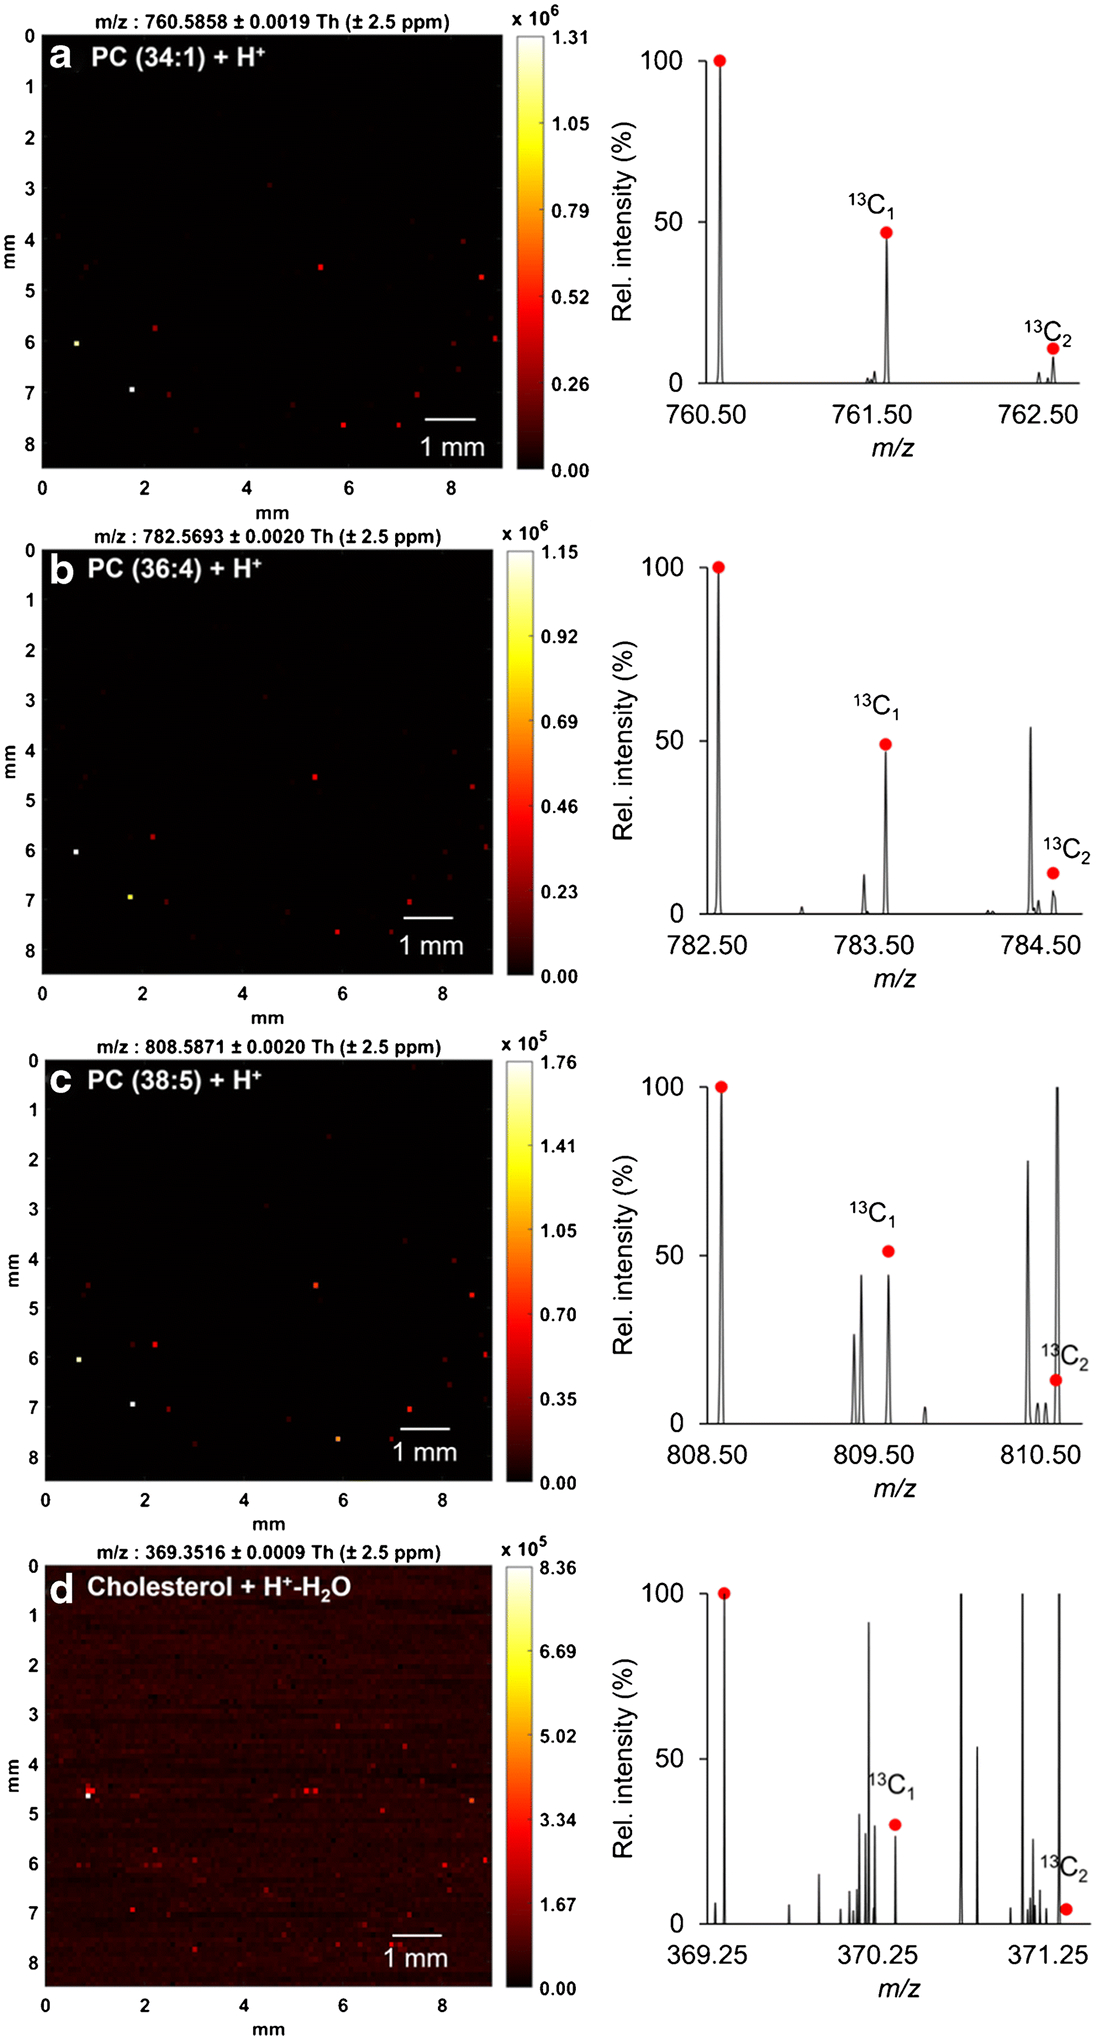
Figure 4.

Ion heatmaps (left) and mass spectra (right) of four representative lipids from a single HeLa cell. (a) m/z 760.5854 ([M+H+]+), (b) m/z 782.5693 ([M+H+]+), (c) m/z 808.5871 ([M+H+]+), (d) m/z 369.3516 ([M+H+-H2O]+). Experimental data are overlaid with the theoretical isotopic distribution in red dots.
