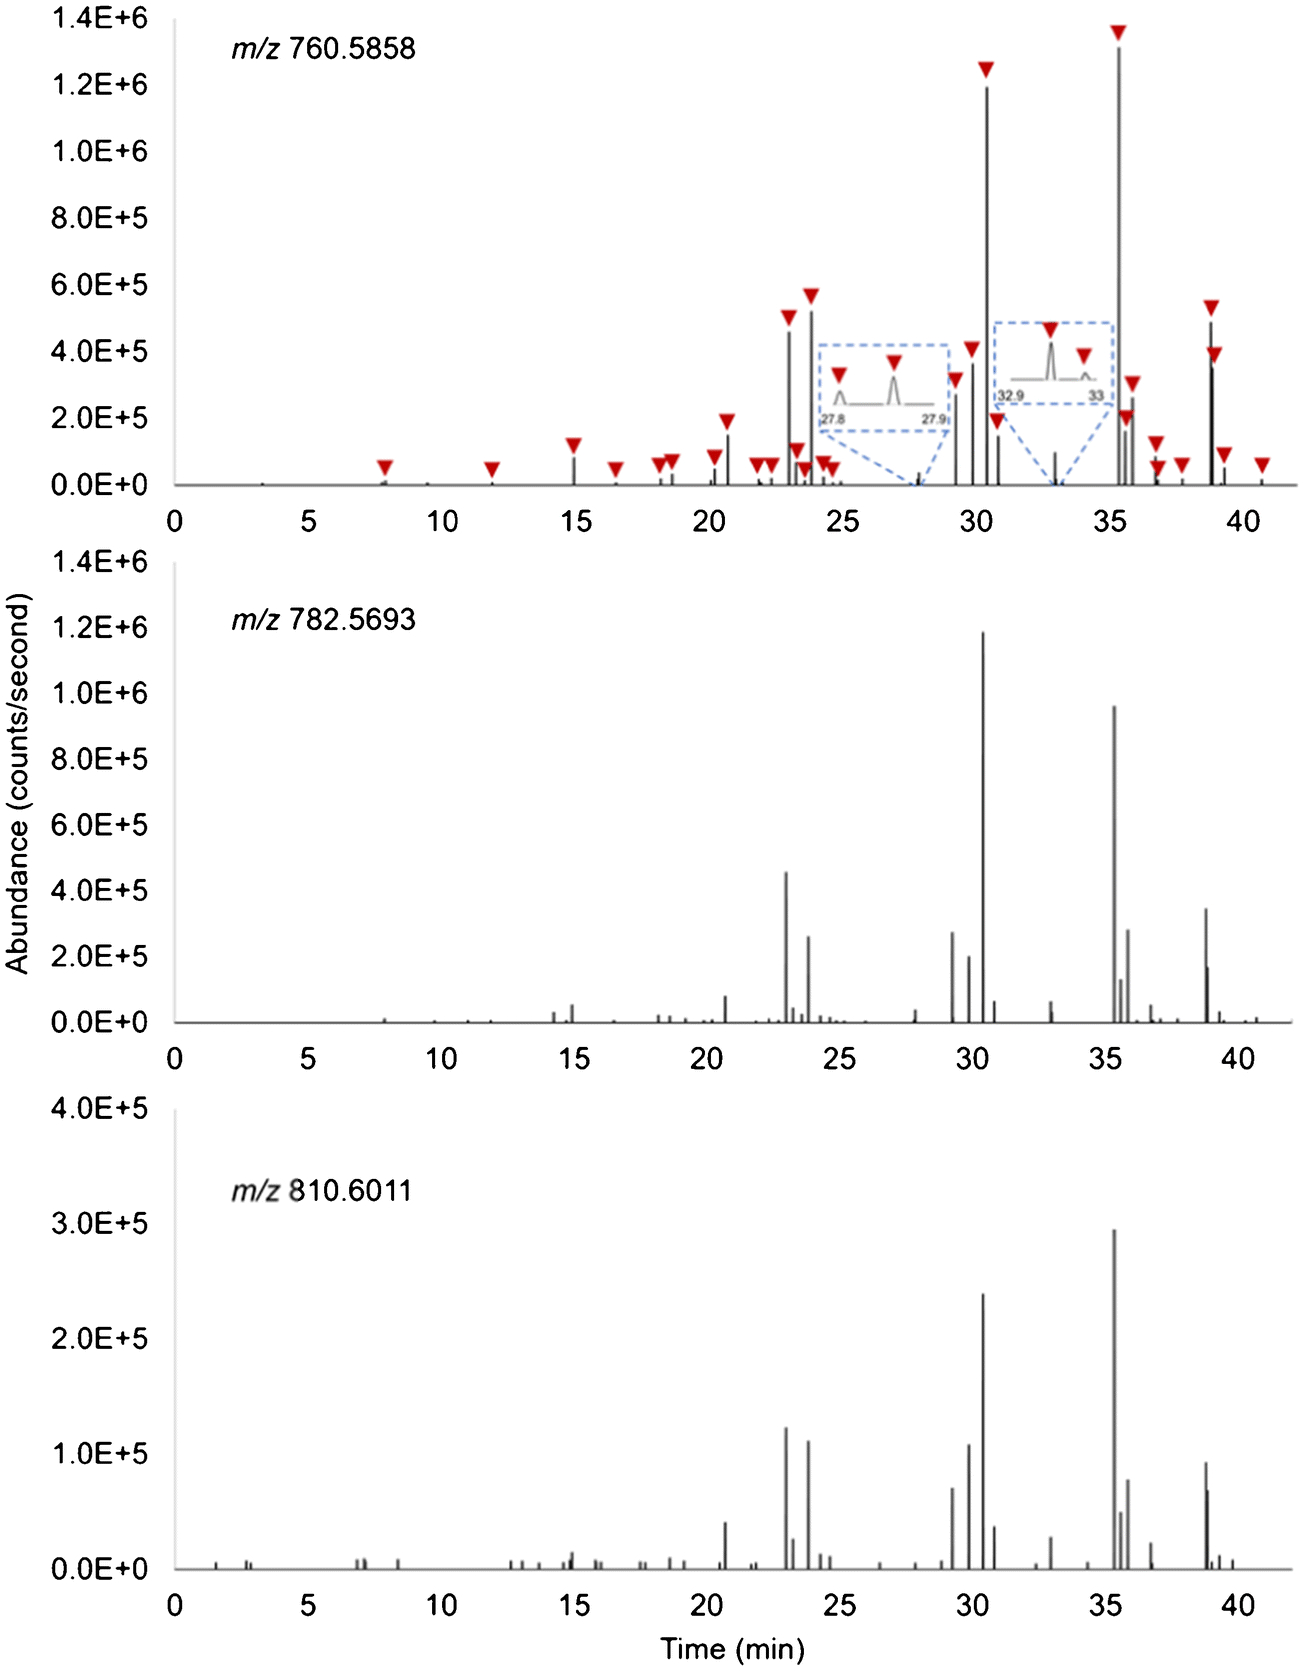
Figure 5.

Extracted ion chronograms of lipids at m/z 760.5858 (top), 782.5693 (middle) and 810.6011 (bottom). Each time point recorded in the chronograms correlates to a specific sampling position (pixel) due to stage movement. The sharp signal rise and drop reflect the cell locations. 34 pixels exhibiting both ions at m/z 760.5858 and 782.5693 were considered as cell-located which are marked by red arrows.
