Figure 6.

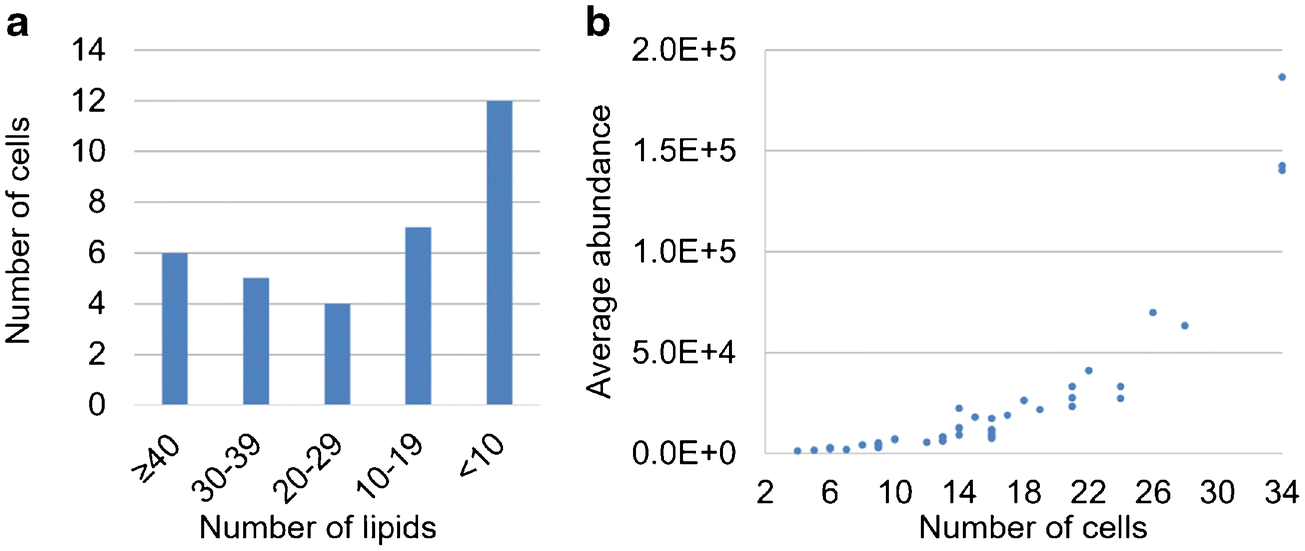
(a) Bar plot summarizes the frequencies of detecting different numbers of lipid species in the 34 cells. (b) Scatter plot exhibits a positive correlation between the ion abundance and the detection frequency.

(a) Bar plot summarizes the frequencies of detecting different numbers of lipid species in the 34 cells. (b) Scatter plot exhibits a positive correlation between the ion abundance and the detection frequency.