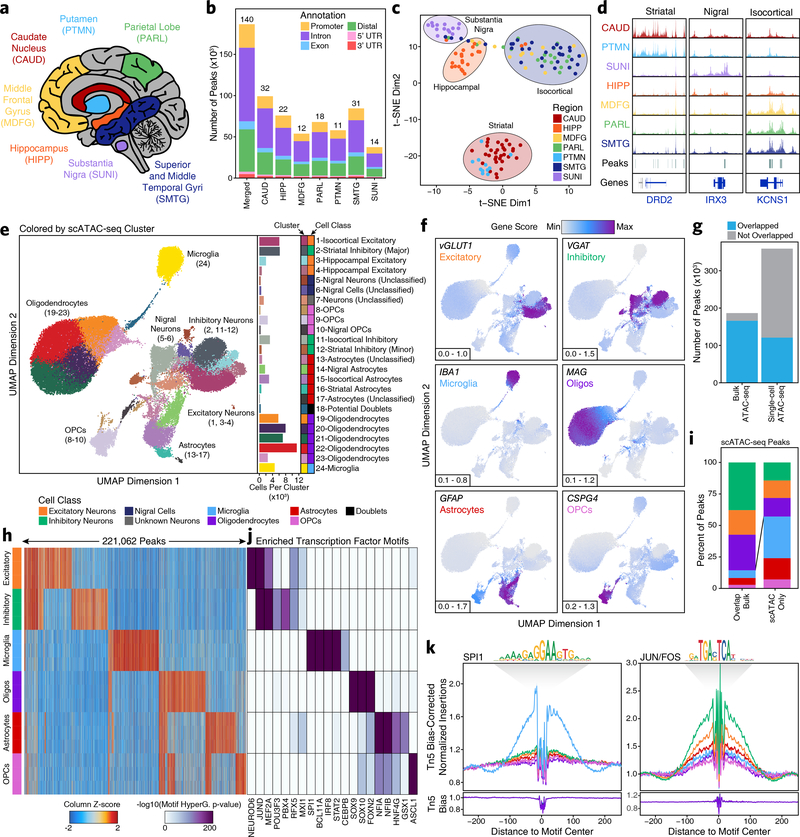
Fig. 1 – Single-cell ATAC-seq identifies cell type-specific chromatin accessibility in the adult brain.
a, Brain regions profiled in this study. b, Bar plot showing the number of reproducible peaks identified from samples in each brain region. The “Merged” bar represents the final merged peak set. The numbers above each bar represent the total number of biological samples profiled for each brain region. c, t-SNE dimensionality reduction of bulk ATAC-seq data. Each dot represents a single piece of tissue with technical replicates merged where applicable. d, Sequencing tracks of region-specific ATAC-seq peaks. From left to right, DRD2 (striatum-specific; chr11:113367951–113538919), IRX3 (substantia nigra-specific; chr16:54276577–54291319), and KCNS1 (isocortex-specific; chr20:45086706–45107665). Tracks have been normalized to the total number of reads in TSS regions. e, Left; UMAP dimensionality reduction after iterative LSI of scATAC-seq data from 10 different samples. Each dot represents a single cell (N = 70,631), colored by its corresponding cluster. Right; Bar plot showing the number of cells per cluster. f, Same as Figure 1e but each cell is colored by its gene activity score for the annotated lineage-defining gene. The minimum and maximum gene activity scores are shown in the bottom left of each panel. g, Bar plot showing the overlap of bulk ATAC-seq and scATAC-seq peak calls. “Bulk ATAC-seq” represents the number of peaks from the bulk ATAC-seq merged peak set that are overlapped by a peak called in our scATAC-seq merged peak set. “Single-cell ATAC-seq” represents the number of peaks from our scATAC-seq merged peak set that are overlapped by a peak called in our bulk ATAC-seq merged peak set. Overlap is considered as any overlapping bases. h, Heatmap representation of chromatin accessibility in binarized peaks (N = 221,062) from the scATAC-seq peak set. Each row represents an individual pseudo-bulk replicate (3 per cell type) and each column represents a peak. i, Bar plot of the percent of peaks from the scATAC-seq binarized peak set that overlap peaks identified by bulk ATAC-seq (“Overlap Bulk”) or are uniquely identified by scATAC-seq (“scATAC Only”). Only peaks found to be unique to a single cell type (N = 172,111) were used in this analysis. Bars are colored according to the legend above Fig. 1h. j, Motif enrichments of binarized peaks identified in Figure 1h. Due to redundancy in motifs, TF drivers were predicted using the average gene expression in GTEx brain samples and accessibility at TF promoters in cell class-grouped scATAC-seq profiles. k, Footprinting analysis of the SPI1 (left; CIS-BP M6484_1.02) and JUN/FOS (right; CIS-BP M4625_1.02) TFs across the 6 major cell classes.

