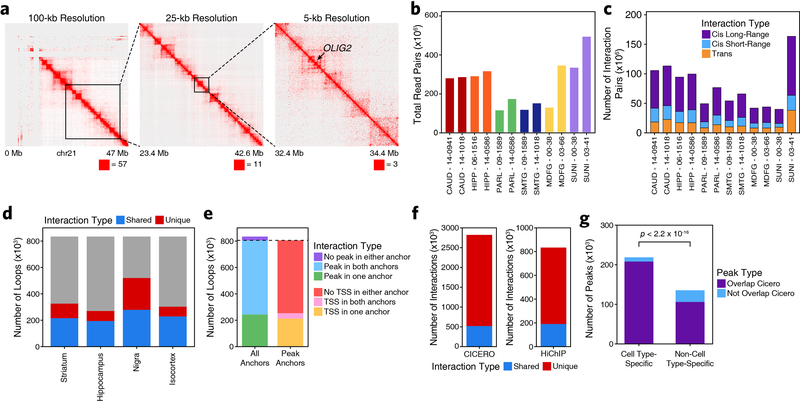
Extended Data Fig. 5. HiChIP and co-accessibilty predict enhancer-promoter interactions in primary adult human brain.
a, Heatmap representation of HiChIP interaction signal at 100-kb, 25-kb, and 5-kb resolution at the OLIG2 locus. Sample shown represents the substantia nigra from donor 03–41. Signal is normalized to the square root of the coverage. The maximum value of the color range and the coordinates along chromosome 21 are shown below each panel. b, Bar plots showing the total number of paired-end reads sequenced for each HiChIP library generated in this study. Color represents the brain region from which the data was generated. c, Bar plots showing the number of valid interaction pairs identified in HiChIP data from all samples profiled in this study. Color represents the type of interaction identified. d, Bar plot showing the overlap of FitHiChIP loop calls from the 4 gross brain regions profiled. Color indicates whether the loop was identified in a single region (unique) or more than one region (shared). e, Bar plot showing the classification of FitHiChIP loop calls based on whether the loop call contained an ATAC-seq peak (from either the bulk ATAC-seq peak set or the scATAC-seq peak set) or TSS in one, both, or no anchor. f, Bar plots showing the number of Cicero-predicted co-accessibility-based peak links that are observed in HiChIP (left) or the number of HiChIP-based FitHiChIP loop calls that are predicted as peak links by Cicero. g, Bar plot showing the number of cell type-specific peaks (defined as peaks identified through feature binarization; N = 221,062) or non-cell type-specific peaks (defined as scATAC-seq peaks that were not identified through feature binarization; N = 137,960) that overlap or do not overlap a Cicero-predicated co-accessibility linkage. Significance determined by Kolmogorov-Smirnov test.

